

| Pasadena Statistics | Details |
|---|---|
| Population | 153,520 (2017) |
| Density | 3,476 people per square mile |
| Average Cost of Car Insurance in Pasadena | $6,628.80 |
| Cheapest Insurance Company | 1 USAA 2 State Farm |
| Road Conditions | Mediocre |
On April 21st, 1836, a battle commenced that would mark two events — the capturing of General Santa Anna at Vince’s Bayou and the end of the Mexican rule over Texas.
It would happen at an unassuming place, near the site of what would later be a bustling city, just hundreds of miles away from the Gulf of Mexico.
That place?
Pasadena, Texas.
Known as the Birthplace of Texas, Pasadena has grown from a small town in the 1800s to a large, economically diverse, major city within the Houston metroplex.
Along the way, there have been bad smells, the resting place of a societal degenerate, and even Urban Cowboy, starring John Travolta.
Pasadena, certainly, isn’t lacking character. But beyond the nicknames and the movies, what are some fun facts to enjoy? There’s that issue we’re all here for today, a little conversation you probably won’t have over mashed potatoes with the family.
It’s car insurance, and if you’re here on this page, you’re probably looking for it for yourself, your family, or a friend.
If you’ve researched car insurance before, you might have found it, well, confusing.
There are all the technical terms, like GAP coverage and hard-braking incidents. Confusing words like deductibles and premiums. Questions about rates and coverage levels.
We understand. We feel your pain. And we’ve got you covered.
This section is broken into three parts:
- All things insurance – coverages, rates, factors that influence rates
- All things driving – roads, vehicles, transportation
- All things Pasadena – its drivers, its repair shops, its air quality
And much more. Get in the car and start that motor. We’re going for a drive through the Birthplace of Texas.
Ready to compare rates? Try our FREE online tool!
The Cost of Car Insurance in Pasadena
Imagine this:
It’s the end of the month and you open up the mailbox, hoping to see a mass of unsolicited checks to cash.
Instead, you see a letter from your car insurance company — those pretty colors, all designed to mask the fact that they will be taking some of your money. But how much?
Maybe you’ve gotten into a fender bender recently or been pulled over for a speeding ticket. Maybe you’ve gotten divorced or had a problem with your credit score.
You walk inside and open it, your eyes tracking the paper until you see the numbers in bold.
“How did they get that?” you say. We understand your confusion.
How car insurance companies set rates can be bewildering. It is often a subject masked behind all those technical terms mentioned in the introduction.
Here, we take a look at nine major factors that impact your car insurance, sometimes to the tune of hundreds, if not thousands, of dollars.
Ready? We’re starting down the first track.
– Male vs. Female vs. Age
You know the story of the 17-year-old boy named Jimmy, right?
Jimmy was excited to get his first car. He could drive to school on his own, take girls out on dates, even get a job farther than walking distance from the house.
He was so excited that when he got into his car for the first time, he cranked it up, put it into gear, and floored it. Right through the garage wall.
17-year-olds are not great drivers; the statistics show that. On top of this, they are prone to risk-taking behaviors.
Insurance companies set their rates accordingly, as they do for all age groups.
The following numbers and raw data about insurance rates in this guide come from our partner Quadrant, which has the insider track into the car insurance industry.
| 35 | 60 | 17 | 25 | Cheapest Rate | Cheapest Age |
|---|---|---|---|---|---|
| $2,828.72 | $2,689.69 | $8,753.30 | $3,541.36 | $2,689.69 | 60 |
There’s over a $6,000 between the rates for 17-year-olds and 60-year-olds.
Aside from 60-year-olds being more experienced drivers, insurance companies believe they are much less likely to take risks.
This results in fewer claims, which is how insurance companies save money.
Insurance companies apply this logic — which group is going to result in fewer claims — to set rates and subvert a well-known driving truism: Men are better drivers than women.
Unfortunately for men (and fortunately for women’s car insurance rates), statistics don’t buy it.
According to a study from the Insurance Institute for Highway Safety, a leading source in the field, men are more likely to die in a motor vehicle accident.
They write,
Men typically drive more miles than women and more often engage in risky driving practices including not using safety belts, driving while impaired by alcohol, and speeding.
This difference affects car insurance rates between men and women. In Pasadena, the difference is a couple of hundred dollars.
- Male average premium: $4,453.27
- Female average premium: $4,203.43
Rates are even more affected if you’re married.
Someone married is seen as more responsible, less likely to behave in risky or reckless ways, and probably more financially secure, as well. This translates over to car insurance rates.
| Demographic | Rate (Cheapest) |
|---|---|
| Married 60-year old female | $2,612.09 |
| Married 60-year old male | $2,767.29 |
| Married 35-year old female | $2,784.45 |
| Married 35-year old male | $2,872.98 |
| Single 25-year old female | $3,438.88 |
| Single 25-year old male | $3,643.85 |
| Average | $4,453.27 |
| Single 17-year old female | $7,978.28 |
| Single 17-year old male | $9,528.32 |
In this case, the difference between the highest rate and the lowest shows the separation between these categories.
The rates for single, 17-year-old males are the highest at around $9,500, while the rates for the married, 60-year-old women are around $2,600 — a $6,900 difference.
There has been a movement recently to stop insurers from using gender as a factor to set car insurance rates, with California being the 6th state to ban the practice.
Some people have seen this as a push for equality; the irony is that the change will benefit teenage males the most, as rates between the sexes will get pushed to the middle.
– Cheapest Zip Codes in Pasadena
There’s another story, this one about two neighbors. They had the same insurance plans and company, but their rates were very different.
Why? It’s simple, really: they lived in different zip codes.
While this story may apocryphal, you might be surprised to know it actually took place, according to the Consumer Federation of America, a watchdog group.
In the case of its study, they found that adjacent zip codes often had insurance rates differing by hundreds of dollars, even if the zip code ran through the subdivision or divided two neighbors.
Why? Insurance companies look at that all-important factor — how likely will claims be filed — and apply it to zip codes.
Some zip codes will have higher vehicle theft than others, or drivers are seen as more likely to get into accidents or get tickets.
How does this look for Pasadena?
| Zip Code | Average Rates |
|---|---|
| 77505 | $6,361.72 |
| 77507 | $6,531.72 |
| 77504 | $6,564.69 |
| 77503 | $6,669.20 |
| 77506 | $6,753.81 |
| 77502 | $6,891.65 |
Pasadena only has six zip codes and the spread between them is just $500. The average person pays $6,628.80 for an insurance premium.
– What’s the Best Car Insurance Company in Pasadena?
Finding the right car insurance company can be tough.
There are different packages and rates, all based on factors not easily available to the average consumer, at least as far as common knowledge goes.
Searching for these factors, trying to understand them, may give you a headache. We understand.
In this section, we’ll cover five major factors and show you how rates change depending on each.
Ready? We’re giving it a little gas.
– Cheapest Car Insurance Rates by Company
Many times, when you’re looking for a product, the first question is, Which one is the cheapest?
In that vein, we have the major car insurance companies in Pasadena listed according to their average premiums. Keep in mind, however: the cheapest might not mean the best.
| Group | Married 35-year old female | Married 35-year old male | Married 60-year old female | Married 60-year old male | Single 17-year old female | Single 17-year old male | Single 25-year old female | Single 25-year old male | Average |
|---|---|---|---|---|---|---|---|---|---|
| Allstate | $3,912.22 | $3,938.90 | $3,860.15 | $3,860.15 | $10,379.66 | $12,505.61 | $4,827.07 | $5,016.39 | $6,037.52 |
| American Family | $3,492.34 | $3,927.06 | $3,331.39 | $3,855.99 | $10,005.99 | $13,085.71 | $5,173.63 | $5,918.67 | $6,098.85 |
| GEICO | $2,747.54 | $2,984.35 | $2,680.75 | $3,081.06 | $6,090.30 | $6,272.28 | $2,971.27 | $2,931.94 | $3,719.94 |
| Nationwide | $2,659.94 | $2,703.12 | $2,344.79 | $2,484.09 | $7,672.34 | $9,861.77 | $3,138.26 | $3,399.01 | $4,282.92 |
| Progressive | $2,679.88 | $2,555.76 | $2,382.70 | $2,425.70 | $11,300.48 | $12,651.23 | $3,194.24 | $3,256.93 | $5,055.87 |
| State Farm | $2,281.35 | $2,281.35 | $2,036.08 | $2,036.08 | $5,503.26 | $7,015.91 | $2,483.32 | $2,553.28 | $3,273.83 |
| USAA | $1,717.91 | $1,720.34 | $1,648.78 | $1,627.94 | $4,895.91 | $5,305.76 | $2,284.35 | $2,430.71 | $2,703.96 |
There are four brackets here:
- State Farm and USAA comprise the cheapest bracket
- Geico and Nationwide comprise the second cheapest bracket
- Progressive is in the upper-middle but in its own price point
- American Family and Allstate are the most expensive
The difference between American Family (the most expensive) and USAA (the cheapest) is $3,400.
When it comes to the price difference, there are many factors at play.
These include what each customer base is purchasing, and what the company is paying its employees, which gets passed onto customers. And these are just prices.
What if we could cross-reference prices with how satisfied each customer base is with its company?
Fortunately, J.D. Power, which does an annual customer satisfaction study for the car insurance industry, has done that for us.
The company with the highest customer satisfaction is USAA, followed by Allstate, Geico, and State Farm. American Family isn’t even listed, which does not bode well for the most expensive company.
– Best Car Insurance for Commute Rates
How much you drive can affect your rates for the simple reason that the more you drive, the more likely you are to get into accidents, get a moving citation, or have to file a claim.
| Group | 10 miles commute | 6,000 annual mileage | 25 miles commute | 12,000 annual mileage | Average |
|---|---|---|---|
| Allstate | $5,887.20 | $6,187.84 | $6,037.52 |
| American Family | $6,098.85 | $6,098.85 | $6,098.85 |
| GEICO | $3,649.86 | $3,790.01 | $3,719.94 |
| Nationwide | $4,282.92 | $4,282.92 | $4,282.92 |
| Progressive | $5,055.86 | $5,055.86 | $5,055.86 |
| State Farm | $3,273.83 | $3,273.83 | $3,273.83 |
| USAA | $2,669.69 | $2,738.23 | $2,703.96 |
Only Allstate, Geico, and USAA change rates by how much you drive. Allstate changes its rates the most, by about $300. USAA does the least, by about $70.
– Best Car Insurance for Coverage Level Rates
Coverage levels can vary for numerous reasons. There are the coverage limits (how much a company will pay), and there’s the addition of other coverages, such as collision.
| Group | High | Low | Medium | Average |
|---|---|---|---|---|
| Allstate | $6,239.30 | $5,890.83 | $5,982.43 | $6,037.52 |
| American Family | $6,848.13 | $5,610.22 | $5,838.20 | $6,098.85 |
| GEICO | $4,014.42 | $3,485.07 | $3,660.32 | $3,719.94 |
| Nationwide | $4,154.15 | $4,597.20 | $4,097.39 | $4,282.91 |
| Progressive | $5,317.26 | $4,814.88 | $5,035.44 | $5,055.86 |
| State Farm | $3,478.48 | $3,083.17 | $3,259.83 | $3,273.83 |
| USAA | $2,819.61 | $2,600.58 | $2,691.69 | $2,703.96 |
Per company, the biggest difference between a low-level coverage and a high-level coverage is American Family ($1,250 difference roughly).
Most companies have a price difference between low-level and high-level coverages of around $200 to $500.
– Best Car Insurance for Credit History Rates
Your credit score may be a good or a bad thing; it can lead to better interest rates on car loans and mortgages, but it can also shoot those interests sky-high, depending on your score.
Your credit score has more than just an impact on loans and rent; it also impacts your car insurance rates.
According to Consumer Reports, which did a study analyzing rates from car insurance companies across the country, companies use credit scores to set rates — but it’s not your FICO.
Insurance companies use this credit score to determine your likelihood to file a claim. The score itself takes into account how risky you are with your finances, among other things.
| Group | Fair | Good | Poor | Average |
|---|---|---|---|---|
| Allstate | $5,623.31 | $4,818.15 | $7,671.10 | $6,037.52 |
| American Family | $5,344.49 | $4,673.32 | $8,278.73 | $6,098.85 |
| GEICO | $3,246.63 | $2,155.37 | $5,757.80 | $3,719.93 |
| Nationwide | $4,126.15 | $3,582.15 | $5,140.45 | $4,282.92 |
| Progressive | $4,917.45 | $4,553.85 | $5,696.29 | $5,055.86 |
| State Farm | $2,888.12 | $2,305.34 | $4,628.03 | $3,273.83 |
| USAA | $2,301.02 | $1,855.20 | $3,955.66 | $2,703.96 |
Five companies have splits higher than $2,000: American Family ($3,600), Geico ($3,600), Allstate ($2,800), State Farm ($2,300), and USAA ($2,100).
Only two companies have less than a $2,000 difference between a good credit score and a poor credit score: Nationwide ($1,600) and Progressive ($1,200).
There has been a push, like with gender, to stop companies from using credit scores as one of the factors determining rates.
This is because some lawmakers believe credit scores punish minority and poor communities.
One representative from Detroit, Michigan, which has some of the highest car insurance rates in the country, has introduced a bill that would prohibit the practice nationwide — but it faces an uphill fight.
– Best Car Insurance for Driving Record Rates
Lawmakers and some consumer advocacy organizations want your rates to be based on one thing, and one thing only, and that’s your driving.
Their logic is simple: your rates should only be determined by the one thing you have control over, which is how well you drive.
| Group | Clean record | With 1 accident | With 1 DUI | With 1 speeding violation | Average |
|---|---|---|---|---|---|
| Allstate | $4,665.09 | $7,255.24 | $7,564.66 | $4,665.09 | $6,495.00 |
| American Family | $5,538.81 | $7,104.22 | $6,213.55 | $5,538.81 | $6,285.53 |
| GEICO | $3,151.78 | $4,187.56 | $3,470.36 | $4,070.04 | $3,603.23 |
| Nationwide | $3,707.89 | $3,707.89 | $5,520.90 | $4,194.99 | $4,312.23 |
| Progressive | $4,402.74 | $5,704.72 | $5,152.64 | $4,963.35 | $5,086.70 |
| State Farm | $2,902.94 | $3,337.12 | $3,952.32 | $2,902.94 | $3,397.46 |
| USAA | $2,008.12 | $2,983.30 | $3,518.06 | $2,306.36 | $2,836.49 |
In a twist from previous tables, Allstate is higher than American Family when it comes to infractions. In large part, this is due to the $1,300 difference in penalties for a DUI.
For those who have incurred infractions, the following companies are best for a speeding ticket, an accident, and a DUI:
- The best companies for a speeding ticket: State Farm and American Family (no change)
- The best company for an accident: Nationwide (no change)
- The best company for a DUI: Geico (+$32o)
When it comes to the companies averaged together, there’s a clear winner in terms of cost when looking at all three citations.
| Clean Record | With 1 Accident | With 1 DUI | With 1 Speeding | Average |
|---|---|---|---|---|
| $3,768.20 | $4,897.15 | $5,056.07 | $4,091.65 | $4,573.81 |
DUIs, which are a full $1,300 above a clean record, are the most costly citation by about $150.
This is closer to the cost of one accident than many other cities, aided in part by American Family’s relatively low penalty for a DUI (+$700) and their high penalty for an accident (+$1,600).
With the last two categories, there are additional fees, such as a citation for an accident or lawyer and court fees for a DUI.
And if you get a DUI, your car insurance rates are probably the least of your concerns.
– Car Insurance Factors in Pasadena
Those are just nine factors that influence car insurance, and there are others as well.
In this section, we cover two that may seem less obvious than the previous — homeownership and education — and hit on some important contextual factors, such as overall earnings in Pasadena.
If there’s one thing we understand, it’s not just that someone pays a certain amount for their premium, it’s how much people pay for their premium as a percentage of their income.
These are the more contextual factors affecting car insurance, and they provide a glimpse into what people know as the Birthplace of Texas.
– Metro Report
Pasadena is part of the Houston-The Woodlands-Sugarland metroplex, making it helpful to look at statistics (at least for this section) for the entire metroplex.
And the numbers in this region show how much Houston and its surrounding areas have grown.
According to the Brookings Institute, a nonprofit in Washington, D.C., Houston has some of the best growth and prosperity from 2005 to 2015, generally in the top five in the country.
For growth, the Houston metroplex had a 25.7 percent rise in jobs, a 47.4 percent rise in the gross metropolitan product, and a 12.7 percent rise in employment at young firms.
For prosperity, the Houston metroplex had a 17.2 percent rise in productivity, a 15.9 percent rise in the standard of living, and an 18.4 percent rise in the average annual wage.
In all these categories, the Houston metroplex outpaced the country average, and they exceeded expectations as well, sometimes by a great deal.
For instance, the expected job growth was 9.2 percent for this time; the Houston metroplex hit 25.7 percent.
– Median Household Income
With all that job growth and wealth, it makes sense that the economic prosperity would filter down to Pasadena, even if it’s just a small part of the Houston metroplex.
However, in general? Not so much.
The following graphs in this section are taken from DataUSA.io, which delves deep into public U.S. government data to produce data sets to cities across the country.
Their work encompasses education to wages to poverty and, in this case, to median household income. For these graphs, Pasadena is always represented in orange.
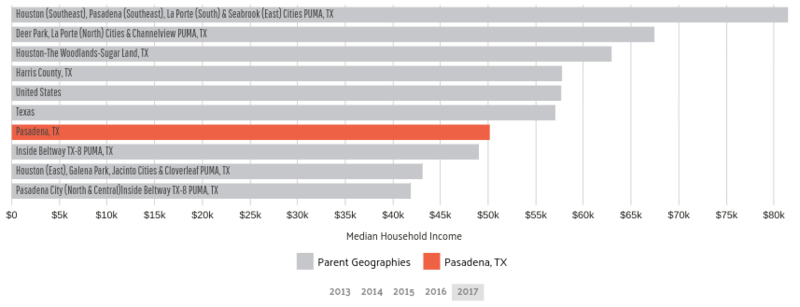
Pasadena has an average median income of $50,207, which is lower than Texas ($57,051) and the Houston metroplex in general ($62,922).
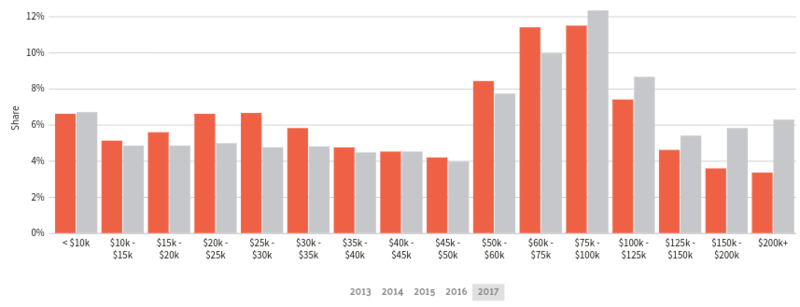
The distribution shows a cluster between $50,000 and $125,000, with a little less than half the population having average annual incomes of $50,000 or less.
Here at TexasCarInsurance.com, we have a statistic that shows the difference a few thousand makes when it comes to paying for car insurance.
We call this statistic Premium as a Percentage of Interest (PaPI).
The person who earns the median income and pays for the average premium spends 13.25 percent of their money on car insurance.
This is a great deal more than the averages in two neighboring cities in the metroplex, but not as much as the average person in Houston.
| City | Median Income Level | Average Car Insurance Premium | Premium as % of Income |
|---|---|---|---|
| Houston | $50,896 | $7,136.56 | 14.02% |
| Pearland | $102,124 | $5,950.57 | 5.83% |
| Missouri City | $88,896 | $6,555.27 | 7.37% |
In the actual city limits of Houston, the median annual income is just marginally above that of Pasadena’s, but the average premium is around $500 higher.
However, some of the outlying cities around Houston have a great deal of wealth, such as Pearland ($102,124) and Missouri City ($88,896). As such, their PaPIs are fairly low in comparison.
To figure out your PaPI, plug your information into the calculator below.
– Homeownership in Pasadena
Being a homeowner can affect your rates, and positively at that.
Many insurance companies offer a homeowner discount, reasoning homeowners are more financially secure and less likely to take risks.
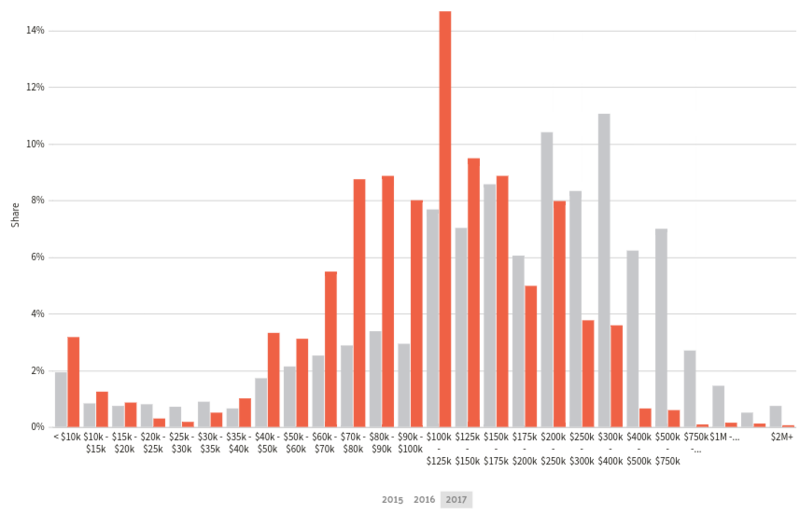
In Pasadena, the average home is worth $108,700, which is a fairly low number.
The distribution shows that most of the homes are valued between $80,000 and $200,000. Overall, people in Pasadena exceed the U.S. average of homes in a particular value bracket within the $100,000 to $125,000 category.
However, they fall behind in everything above $200,000, with a big gap between $200,000 and $500,000. A little over 3 percent have homes worth $10,000 or less.
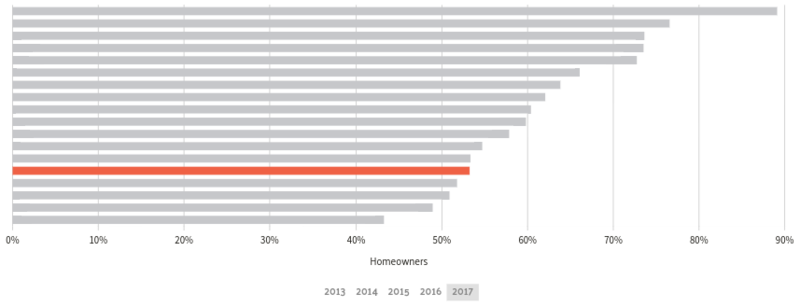
Rent-to-own is a statistic that shows the ratio between owner-occupied residences and renters. Pasadena’s 2017 value is 53.3 percent, lower than the national average of 63.9 percent.
This indicates that not much housing wealth is built up in the actual city residents, as nearly half are renters and are therefore not building equity.
This could hurt overall economic health as well, as people who are renters are more likely to have a smaller median income and possibly will less disposable income to pour into an economy.
– Education in Pasadena
Education is another factor affecting car insurance rates. Some companies offer discounts to those that have at least a four-year college degree.
Their calculations probably show people who are more educated are less likely to take risks and file claims.
For Pasadena in 2016, two universities accounted for nearly 100 percent of all the degrees issued:
- San Jacinto Community College (6,500 degrees or 71.1 percent)
- University of Houston-Clear Lake (2,600 degrees 28.1 percent)
The bachelor’s degrees were varied between numerous liberal arts degrees, business degrees, and some healthcare-related degrees.

The leading degrees awarded (other than “Other”) were General Psychology (130), Accounting (119), and Healthcare Administration and Management (60).
One- to two-year post-secondary degrees were much more varied compared to some other cities in Texas.
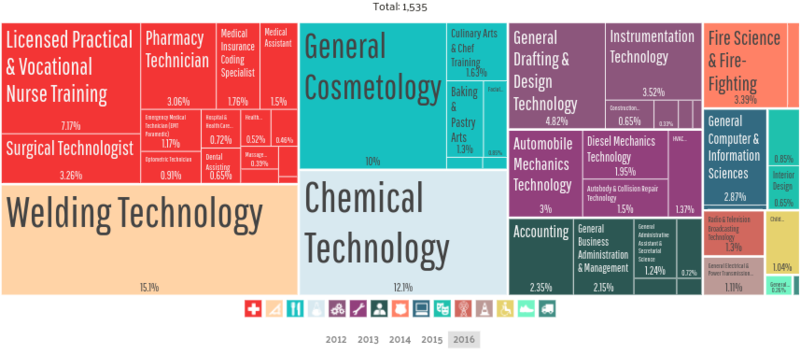
The top three certificates awarded were Welding Technology (232), Chemical Technology (185), and Cosmetology (154).
Pasadena, compared to many other cities, is big on construction-related trades, as a glance shows 40 percent of certificates are related to that industry.
– Wage by Race & Ethnicity in Common Jobs
Wages vary according to race; this certainly is not news. Some say it is the result of an inequality gap, with some races earning more, sometimes much, more than minority groups.
Without a doubt, this affects the amount some racial groups pay for car insurance.
Of course, it depends on the position, as well as what job is being worked, as the wages for race differ according to job type.

Those are five categories, each with varying income levels for each race. After Miscellaneous Managers, the spread evens up a little, but there are still discrepancies.
For our analysis, we took a look at two categories — Miscellaneous Managers and Driver/Sales Workers & Truck Drivers — and calculated PaPI according to race.
| Ethnicity | Miscellaneous Managers | PaPI | Driver/Sales Workers & Truck Drivers | PaPI |
|---|---|---|---|---|
| Asian | $107,939 | 6.14% | $32,915 | 20.14% |
| White | $103,761 | 6.39% | $43,226 | 15.34% |
| Two or More Races | $89,714 | 7.39% | $40,907 | 16.20% |
| American Indian | $74,900 | 8.85% | $41,195 | 16.09% |
| Black | $73,311 | 9.04% | $43,371 | 15.28% |
| Other | $64,955 | 10.21% | $46,597 | 14.23% |
| Other Native American | $60,677 | 10.92% | $35,787 | 18.52% |
| Native Hawaiian or Other Pacific Islander | $46,959 | 14.12% | $38,587 | 17.18% |
Within Miscellaneous Managers, the highest-earning race (Asians at $107,939) pays 6.14 percent of their income on car insurance.
The lowest-earning race? Native Hawaiians or Other Pacific Islanders ($46,959) who pay 14.12 percent of their income on car insurance.
For Driver/Sales Workers & Truck Drivers, the spread evens a bit between the races — $46,597 for the Other category and $32,915 for Asians.
The difference in PaPIs for those two race groups is a little more than 6 percent — 14.23 percent to 20.14 percent.
Earning $10,000 more makes a great deal of difference when it comes to the percentage of income you spend on car insurance.
And some racial groups might benefit more than others.
– Wage by Gender in Common Jobs
Along with the racial wage gap, the gender wage gap is well known. Women make 79 cents per every dollar that men make, which is due in part to the lack of advancement opportunities.
And the gender wage gap is alive and well in Pasadena.
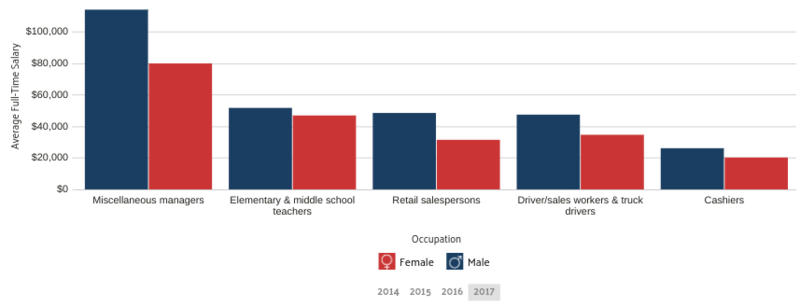
In every category, men make more than women, including in a female-dominated profession like teaching. This makes a difference in how much women pay on car insurance.
| Occupation | Male Salary | Premium as % of Income | Female Salary | Premium as % of Income |
|---|---|---|---|---|
| Miscellenous Managers | $113,924 | 5.82% | $79,734 | 8.31% |
| Elementary and Middle School Teachers | $51,746 | 12.81% | $46,591 | 14.23% |
The largest gap is between male miscellaneous managers and female miscellaneous managers: a $34,000 pay difference and a 2.5 percent difference in PaPI.
For elementary school teachers, the pay gap is less pronounced, but it still affects the PaPI of women: a $5,000 pay difference and a 1.4 percent difference in PaPI.
You might ask, Why is there such a little gap in PaPI for miscellaneous managers compared to teachers when the difference in pay is much larger?
The answer is that the lower your income, the higher the percentage of that income you’ll pay proportionately.
For instance, a drop in $5,000 from $85,000 to $80,000 matters less than from $45,000 to $40,000. You’ll be affected less. It’s a sliding scale.
The lower you go, the more it hurts.
It’s for this reason, among others, that organizations are committed to ending both the racial and gender wage gap.
– Poverty by Age & Gender
Pasadena has a lot of poverty.
According to DataUSA.io, 19.3 percent of the population in Pasadena lives in poverty, higher than the national average of 13.4 percent.
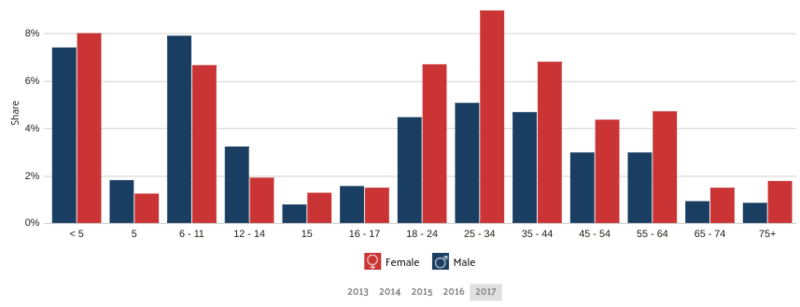
Three of the largest groups in poverty are either women or children:
- Females aged 25 – 34: 8.96 percent
- Females aged 5 or younger: 8.02 percent
- Males aged 6 – 11: 7.92 percent
Women outnumber men in poverty in nine out of the 13 categories, including every category after 16- to 17-year-olds.
This is not necessarily surprising. According to Legal Momentum, The Women’s Legal Defense and Education Fund, women are 35 percent more likely to be poor than men in America.
35 percent of single mothers raise their children in poverty.
It is a serious issue that anti-poverty organizations are trying to solve.
– Poverty by Race & Ethnicity
But poverty isn’t just about gender and age. Certain races get affected as well.
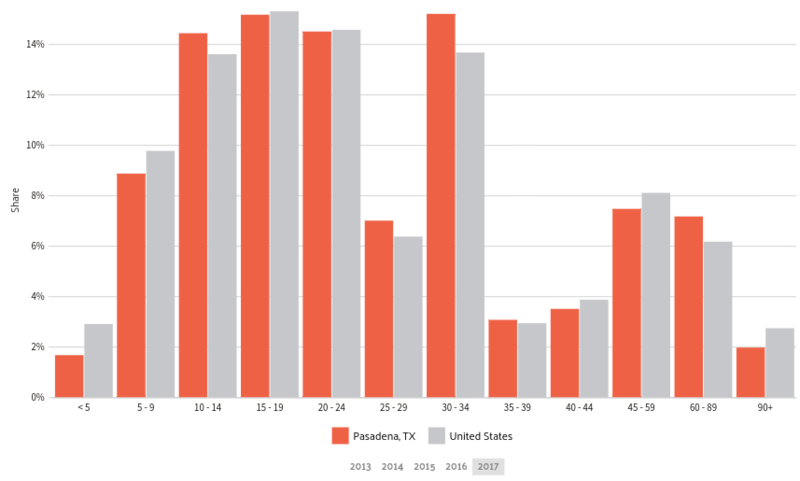
With this next graph, look at how the racial population is distributed in Pasadena, as the next graph is based on percentage share (comparing different races to others).
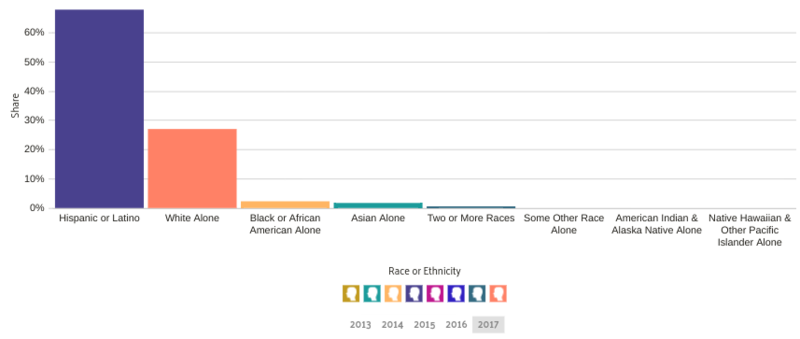
Hispanics make up over 60 percent of the population, while those who identify as whites alone make up a little less than 30 percent of the population. The other races are minimal.
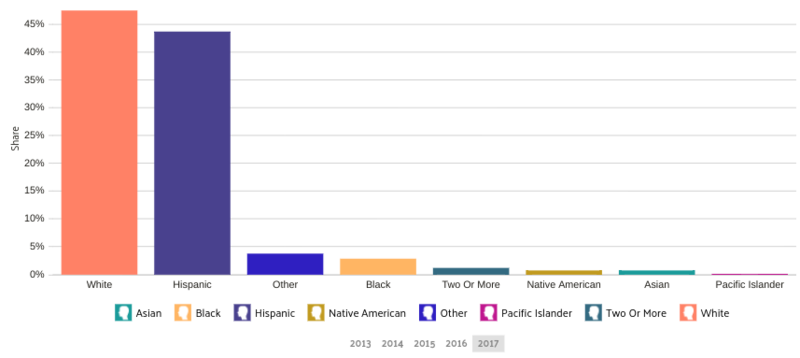
Let’s take a look at the poverty statistics.
In this case, those who identify as white have a poverty share higher than those who identify as Hispanic, which is disproportionate to their population shares.
There aren’t just more whites in poverty than Hispanics, there’s a much higher percentage of their population in poverty, as well.
– Employment by Occupations
If two industries dominate Pasadena, it is the construction and production industries. Pasadena has a long history with these industries, as some of the original attempts to form the city in the late 1800s involving railroad and shipping.
This is reflected in the distribution of workers according to the occupation, with a graph by DataUSA.io.
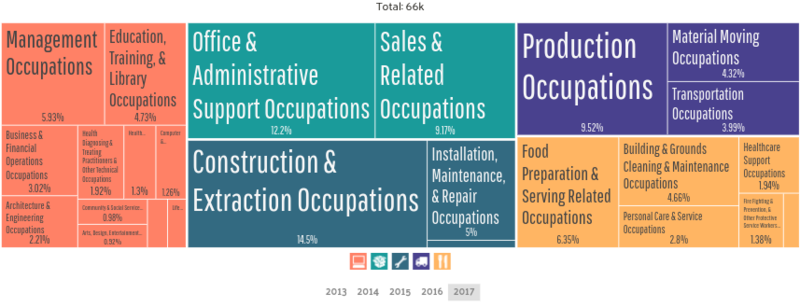
The three largest occupations are in the construction, production, and administration occupations.
- Construction & Extraction Occupations: 14.5 percent
- Production Occupations: 9.52 percent
- Office & Administrative Support Occupations: 12.2 percent
Overall, the construction and production occupations account for over 37 percent of the occupations in Pasadena.
The most varied occupational category is management, business, science, and arts.
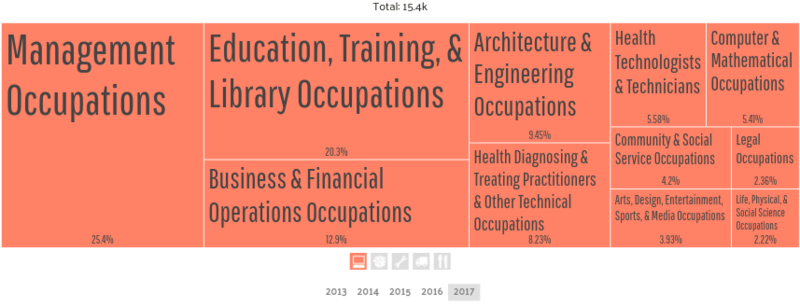
In the category itself, the top three occupations are management (25.4 percent), education, training, and library (20.3 percent), and business and financial operations (12.9 percent).
For standalone industries, construction rules at 16.6 percent of workers employed in that industry. Manufacturing is next, with 13.3 percent, and retail trade at 11.1 percent.
Driving in Pasadena
Imagine this:
You’re driving down the freeway, listening to one of Pasadena’s finest — Mickey Gilley — when you push a little harder on the gas.
As you’re rounding the bend, you notice a small shape huddled near the bottom of a pillar on the overpass. You start to ease off the gas — just out of habit — but it’s not enough.
The cop starts their motorcycle as you drive by, and the blue lights start to flash. It seems like we’ve all been in this situation before, and it can always happen again. But wouldn’t you like to know how to prevent it?
This is the Driving section of this comprehensive guide for car insurance in Pasadena. Here, we cover everything from speed traps to major highways, vehicle theft to repair shops.
And yes, those all-important road trip destinations.
We’re rounding the second bend. It’s time to shift into second gear.
– Roads in Pasadena
Have you ever driven down a road late at night with minimal visibility? The street lamps are dim, your headlights can’t catch everything, and suddenly there’s a shape in the street.
You swerve but your car hits the object and dips.
There’s a large screeching sound, and you think, That sounded expensive.
Road conditions are a major issue in many cities, with poor road conditions contributing to drivers losing hundreds of dollars lost every year.
We understand and feel your pain.
In this section, we cover road conditions, along with major highways and red-light cameras. We also give you a taste of the road trip destinations near Pasadena.
– Major Highways
Pasadena is connected directly to three major highways.
| Interstate/Highway | Length (Miles) | Toll Road | Nickname |
|---|---|---|---|
| Interstate 45 | 284.9 miles | No | Gulf Freeway |
| State Highway 225 | 15.6 miles | No | Pasadena Freeway |
| Beltway 8 | 88.1 miles | Yes | Sam Houston Parkway |
Beltway 8 gets an important mention as it lies in Harris County, traversing a wide circle around Houston. It is 88 miles in length and is mostly a tollway.
Texas has the most toll roads of any state, with 25. They are scattered throughout the state, with a good portion near the major city centers — Austin, Houston, and Dallas.
What do you do if you cross one? Or if you need to use them often? There are three tags to choose from and one more convenient option.
| Name | Area | Type | Options | Start-Up Cost |
|---|---|---|---|---|
| TxTag | TX, KS, OK | electronic tag | TxTag | $20 initial deposit $20 initial replenishment level $7.99 for tag |
| EZ Tag | TX | electronic tag | EZ Tag EZ Tag Express Bang Pass | $55 total $40 total $40 total |
| TollTag | TX | electronic tag | Starter TollTag TollTag | $20 prepaid toll deposit $40 prepaid toll deposit |
| ZipCash | TX | photo of license plate | ZipCash | Up to 50% more than the tags |
Typically, they follow those three city centers: TxTag is popular around Austin, EZ Tag around Houston, and TollTag around Dallas.
However, they are generally interchangeable throughout the state; having one provides access to the toll roads the other companies service.
For those not interested in getting a tag, it’s possible to go through the tollways without them.
In this case, the camera at the tollway will snap a picture of your license plate and send you a bill. A fair warning though: if you don’t pay your bill, your vehicle could be impounded.
Although this would only happen in extreme circumstances, it’s still something to consider.
– Popular Road Trips/Sites
Got a day and a tank of gas? Check out these four road trip destinations.
- Shreveport, Louisiana (4 hours, 250 miles): The third-most populous city in Louisiana, Shreveport has great food, ample culture, and many fun activities, whether you are a solo traveler, with your significant other, or with family. Check out the aquarium, browse for rare books, visit the casinos, or, of course, try the amazing Cajun food.
- Big Bend National Park (10.5 hours, 622 miles): Big Bend National Park, some would say, is one of the most underrated, with its over 1,000 species of plants, 450 birds, and 75 mammals. It’s also home to some dinosaur bones and sea fossils, both of which are good photo ops. You can backpack through it, take a car, hike, bike, and more. It’s an outdoor paradise.
- Waco, Texas (3 hours, 198 miles): Home to two of HGTV’s biggest stars and the Dr. Pepper Museum, Waco is a haven for people who like something, well, a little old school. It’s renowned for its antique shops, including the Magnolia Market at the Silos, which stretches for two city blocks. There’s also Balcones, if you like world-class whiskey.
- Mustang Island State Park (4 hours, 221 miles): Once frequented by the famed 19th-century pirate Jean Lafitte, Mustang Island got its name from the livestock Spaniards brought over. Today, you can take part in all things nature — swimming, laying on the beach, or fishing. Keep an eye out for the rare Kemp’s Ridley, the world’s smallest sea turtle.
– Road Conditions
Road conditions can cost you money: a busted tire, a scraped fender, even a run off the road because the signage is bad.
Because Pasadena is part of the Houston metroplex, we looked at Houston data for roads. Even if it’s not Pasadena, there’s a good chance you’ll be driving there.
| Poor Share | Mediocre Share | Fair Share | Good Share | Vehicle Operating Cost |
|---|---|---|---|---|
| 24% | 28% | 11% | 38% | $610 |
The road conditions are split down the middle. While 38 percent are good, 51 percent are either mediocre or poor.
What does a poor road look like? The law firm Edgar, Synder, and Associates has an answer.
- Clear zone issues, like fixed objects in the road
- Shoulder drop-off, such as when the shoulder drops more than two inches
- Wheel ruts, which are grooves in the road on which tires can catch
- Potholes
Poor roads can cause accidents, can cause damage to your car — resulting in hundreds of dollars of maintenance and repairs each year (for Houston/Pasadena, that number is $610) — and can lead to lawsuits, as well.
– Does Your City Use Speeding or Red-Light Cameras?
The short answer, when it comes to red-light cameras, is no.
Earlier this year, the governor of Texas, Greg Abbott, signed a bill outlawing the use of red-light cameras, which were being used across the state of Texas by various municipalities.
Since then, almost all cities have discontinued the use of them.
While there is no clear explanation for the outlawing, many citizens were increasingly upset about the quick-trigger cameras that were capturing no actual violation.
Per June 2019, Texas is the eighth state to do so, and it’s possible others will follow.
[[need video here]]Vehicles in Pasadena
Back to those flashing blue lights.
They hide behind pillars, in ditches, and around corners with their radar guns. Not only can a ticket cost upwards of $100, but it also causes a spike in your insurance rates. So, how can you stop them or avoid those speed traps?
That’s what we’re here for.
In this section, we cover things like how many cars per household, the percentage of homes without a car, speed traps, vehicle theft, and, of course, just how safe Pasadena is.
We’re continuing our ride through Pasadena.
– How Many Car Per Household
Generally, when it comes to car ownership, the average American family is most likely to own two cars. How is that reflected in Pasadena?
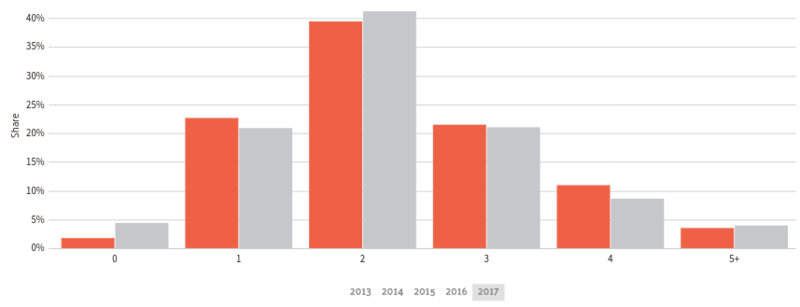
Pasadena is roughly in line with the national averages, as the average household is most likely to own two cars, with a near split between one car and three cars coming in second.
Residents of Pasadena are more likely to own four cars compared to the U.S. average, and they are less likely to not own a car.
Free Car Insurance Comparison
Compare Quotes From Top Companies and Save
– Households Without a Car
Below is some information about households that do not own a car.
| 2015 Households without Vehicles | 2016 Households without Vehicles | 2015 Vehicles per Household | 2016 Vehicles per Household |
|---|---|---|---|
| 5.80% | 5.70% | 1.78 | 1.88 |
Just less than 6 percent of households in Pasadena do not own a car, a number that shrank from 2015 to 2016, by 0.1 percent.
As the Federal Highway Administration notes, households without a car are more likely to be in poverty and struggle from mobility issues, which can include having to carpool to work, having to use public transportation, or having to rely on friends or extended family for rides.
The Internal Revenue Service has tried to alleviate some of these issues by offering tax reimbursement for miles logged, but the problem remains.
– Speed Traps in Your City
Speed traps are a disappointing part of life, but you don’t always have to get a ticket. That’s why we’re sharing this list.
Speedtraps.org is a site that allows users to submit speed traps they’ve encountered and have other users verify or discredit those submissions.
The bad news is Pasadena is ranked in the top 10 worst Texan cities for speed traps (Houston being number one).
So, what are the speed traps in Pasadena? We start with the most recent and give you three.
- Truxton and Ramsey: If you’re coming from Glenmore to Ramsey and you go down Truxton, please be sure to stop at the stop sign completely, as there is an officer parked three to four houses down videotaping you.
- BW8 toll bridge: When they tore down the toll booths, they dropped the speed limit. Police sit where the old booth was, as well as just over the northbound overpass.
- Shaver/Fairmont/Edgebrook/Allen Genoa Road: One must be very careful at all times, as people make a left turn onto Shaver from Edgebrook, because they think the two turns are legal.
There have been 72 speed traps listed over 17 years. Some of these are dated, but speed trap locations throughout a city will often remain the same, as there are limited options to set up new ones.
– Vehicle Theft in Pasadena
What are the motor vehicle theft statistics in Pasadena? These numbers come from NeighborhoodScout, which looks at FBI data culled from over 18,000 law enforcement agencies around the country to provide city statistics.
These statistics are from 2018 and cover the 2017 calendar year.
| Area | Motor Vehicle Theft (Total) | Motor Vehicle Theft Rate |
|---|---|---|
| Pasadena | 384 | 2.5 |
| United States | 773,139 | 2.37 |
Unfortunately, the motor vehicle theft rate in Pasadena is higher than the national average.
| Pasadena Total Crimes | Violent | Property | Total |
|---|---|---|---|
| Number of Crimes | 716 | 3,865 | 4,581 |
| Crime Rate (per 1,000 residents) | 4.66 | 25.18 | 29.84 |
In terms of overall crimes, a person living in Pasadena has a 30 in 1000 chance of being a victim of crime — 4.7 chance of violent crime, 25 percent chance of property crime.
In general, violent crimes are more prevalent in Pasadena than in the general United States.
| Area | Murder (Total) | Murder Rate | Robbery (Total) | Robbery Rate | Assault (Total) | Assault Rate |
|---|---|---|---|---|---|---|
| Pasadena | 5 | 0.03 | 195 | 1.27 | 420 | 2.74 |
| United States | 17,284 | 0.05 | 319,356 | 0.98 | 810,825 | 2.49 |
While the murder rate is lower in Pasadena compared to the United States generally, the robbery and the assault rates are higher.
If you’re concerned about the rates of crime, it may help to look at the safest neighborhoods in Pasadena. As the most dangerous neighborhoods are in the north of the city, the safest neighborhoods are either south or to the east of the city center.
- Bay Area Blvd / Middlebrook Dr
- Fairmont Pky / Nations Dr
- Red Bluff Rd / Rainforest Trail Dr
- Texas Chiropractic College Foundation Inc / Spencer Hwy
- Louisiana Ave / San Augustine Ave
- E Sam Houston Pky S / Spencer Hwy
- Southmore Ave / Burke Rd
- Golden Acres
- Pasadena Blvd / Huckleberry Ln
- Pansy St / Pasadena Blvd
And if you’re seriously concerned about vehicle theft, there are always things you can do to prevent it. Watch the video below to learn more.
Traffic
Traffic. It’s the worst. There are few things worse than sitting in rush hour traffic, waiting for that wreck to clear up when you to be at work in 15 minutes for a meeting.
It may give you a headache or raise your blood pressure. Either way, it’s costing you in terms of time, money, and productivity and doing few positive things for your stress level.
We understand. We’ve been there. That’s why we put this section together to give you a look at traffic in Houston, what commute times are, and just how good or bad drivers are, and how safe the streets are in Harris County.
Get ready to roll down those windows and honk that horn.
– Traffic Congestion in Texas
The good news is Pasadena isn’t listed in any of the major traffic collating websites (TomTom, INRIX, Numbeo), though Houston is, and ranked 204th in the world of worst cities for traffic.
What are the actual statistics for how bad the traffic is?
TomTom uses several metrics for calculating the traffic congestion in a city or state, looking at how traffic freely flows as a baseline and then calculating time spent in traffic.
For Houston, it looked at around five billion kilometers of roadway, including at about three billion highway roadway and about two billion non-highway roadway.
It found that congestion was 22 percent for highways and 24 percent for non-highways. The best day was December 25; the worst, October 31.
The morning congestion is much less than the evening congestion — 42 percent compared to 59 percent. To a typical 30-minute trip, 13 minutes and 18 minutes would be added, respectively.
The worst times for traffic were Monday – Thursday, around 5 pm. The takeaway is, don’t drive in Houston on Halloween Night. Houstonians must like to party.
– Transportation
Commute times and by what method commuters get to work can also be helpful to analyze.
In Pasadena, the average commute time is 25.5 minutes, near the U.S. average of 25.1 minutes.
While a healthy portion of the commute times falls between five minutes and 24 minutes, there’s a huge block at 30 – 34 minutes and fairly long commutes after that, likely explained by people working in Pasadena versus those commuting to Houston or another area in the metroplex.
Residents of Pasadena have slightly different ways of getting to traffic, as well.
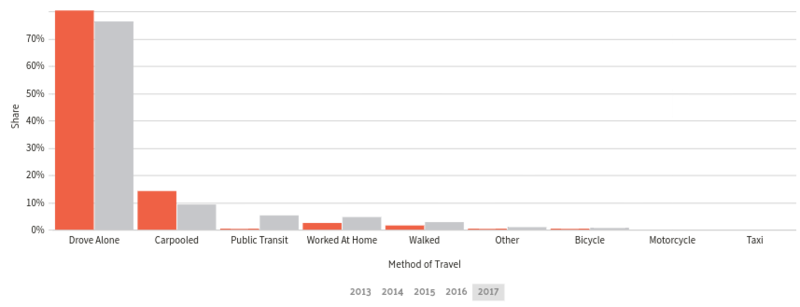
Whereas parts of the country tend to use public transportation, work from home, or walk, the vast majority of residents of Pasadena carpool or drive alone to work.
This may speak to the public transport system in Houston, rising gas prices, far driving distances, or all three.
– Busiest Highways
According to the Texas A&M Transportation Institute, the Houston metroplex has 38 of Texas’s most congested roads.
One of those roads runs through Pasadena: I-65, the Gulf Freeway. Texas A&M broke up that road into two segments: into the loop, and then into the city center.
The one running from Pasadena to the loop has over 3 million hours in traffic delay, nearly 400,000 hours of delays per mile, and a congestion cost of $61 million.
It is ranked 27th in Texas in the worst roads for traffic.
The one that runs from the loop into Houston is ranked even worse — 11th — and 5.5 million hours of delay, 700,000 delays per mile, and a congestion cost of $114 million.
The report is annual, reflecting statistics of a previous 365-day time period, and is calculated using GPS speed reports and help from INRIX.
The takeaway: if you’re planning to use the Gulf Freeway to go into Houston, bring some snacks and Coke. It may be a bit before you reach your destination.
– How Safe Are Pasadena’s Streets and Roads?
Traffic is a critical issue we face daily. But while those may be nuisances, there are more serious issues that come up on streets and roads: safety and fatalities.
These may be grim topics, but the statistics are important. They give us a view of why fatal accidents occur in an area, which ones to look out for, and how you might plan to be safe.
For this data, we looked at the National Highway Traffic Safety Administration‘s (NHTSA) database and culled together information from a variety of categories.
| Harris County Statistics | 2013 | 2014 | 2015 | 2016 | 2017 | Total |
|---|---|---|---|---|---|---|
| Total Fatalities | 369 | 417 | 391 | 447 | 456 | 2080 |
| Alcohol-Impaired | 174 | 210 | 170 | 209 | 202 | 965 |
| Single Vehicle | 209 | 216 | 220 | 263 | 242 | 1150 |
| Speeding | 121 | 136 | 107 | 135 | 105 | 604 |
| Roadway Departure | 155 | 177 | 166 | 175 | 173 | 846 |
| Intersection-Related | 77 | 103 | 89 | 102 | 115 | 486 |
| Passenger Car | 118 | 146 | 124 | 147 | 149 | 684 |
| Pedestrian | 93 | 90 | 98 | 130 | 109 | 520 |
| Pedalcyclist | 9 | 12 | 10 | 11 | 14 | 56 |
There were 2,080 total fatalities in Harris County for 2017, which is a number higher than average compared to many areas in the country.
As the Houston Chronicle notes, the drivers in Houston are the most deadly in the country.
The highest subcategory is single vehicle, which is a crash that only involves one vehicle.
HG.org, a legal authority, says,
This can include accidents like running off the road, colliding with fallen rocks, running over debris on the road, losing control of the vehicle and rolling it, hitting animals, and so forth.
In many cases, single-vehicle crashes go hand-in-hand with roadway departures, which occur when a car crosses the centerline, runs onto the shoulder, or runs off the road.
846 crashes were categorized as roadway departures from 2013 – 2017.
Alcohol-impaired fatalities were the second-largest sub-category from 2013 – 2017, with 965 crashes being categorized as such. According to Pierce | Skrabenek, a law firm, Houston led the state in drunk-driving crashes in 2011 and 2012, suggesting it’s a serious problem in the area.
The rest of the subcategories are much lower, but there’s an important note: pedestrian deaths have been on the rise since 2013, starting at 93 and ending at 109 in 2017, peaking at 130 in 2016.
Houston’s roads can be dangerous, so take caution.
| Road Type | Fatal Crashes |
|---|---|
| Rural Interstate | 176 |
| Urban Interstate | 402 |
| Freeway/Expressway | 260 |
| Other | 982 |
| Minor Arterial | 652 |
| Collector Arterial | 600 |
| Other | 261 |
| Unknown | 10 |
| Total | 3,343 |
The NHTSA also has a fatality analysis reporting system (FARS) that categorizes fatalities according to road type. According to FARS, interstates and highways are not the issues, arterial roads are.
According to the Federal Highway Administration,
[Principal arterials] serve major centers of metropolitan areas, provide a high degree of mobility and can also provide mobility through rural areas.
And,
Minor Arterials provide service for trips of moderate length, serve geographic areas that are smaller than their higher Arterial counterparts and offer connectivity to the higher Arterial system.
They can be some of the most trafficked roads, influencing the number of deaths.
Railroads are also an issue in Harris County. These statistics come from the U.S. Department of Transportation.
| Highway User Speed | Calendar Year | Highway | Highway User Type | Rail Equipment Type | Non-Suicide Fatality | Non-Suicide Injury | City |
|---|---|---|---|---|---|---|---|
| 0 | 2012 | TIDWELL RD | Automobile | Freight Train | 0 | 0 | - |
| 0 | 2012 | US 59 NB FRONTAGE | Automobile | Freight Train | 0 | 0 | BELLAIRE |
| 0 | 2012 | CULLEN BLVD | Pick-up truck | Light Loco(s) | 0 | 0 | HOUSTON |
| 5 | 2012 | BOCARD #2 | Truck-trailer | Freight Train | 0 | 0 | HOUSTON |
| 5 | 2012 | COLLINGSWORTH STREET | Truck-trailer | Freight Train | 0 | 1 | HOUSTON |
| 0 | 2012 | HEIGHTS BLVD | Pedestrian | Freight Train | 0 | 0 | HOUSTON |
| 5 | 2012 | RAILWOOD | Truck-trailer | Light Loco(s) | 0 | 0 | HOUSTON |
| 0 | 2012 | LAURA KOPPE RD | Automobile | Freight Train | 0 | 0 | HOUSTON |
| 0 | 2012 | WOODLAND | Pick-up truck | Freight Train | 0 | 1 | CHANNELVIEW |
| 0 | 2012 | PRIVATE | Automobile | Freight Train | 0 | 0 | - |
| 0 | 2012 | RAMSEY RD | Truck-trailer | Freight Train | 0 | 0 | CROSBY |
| 0 | 2012 | RICHEY ROAD | Truck-trailer | Freight Train | 0 | 0 | - |
| 5 | 2012 | OIL TRAVLING WEST MA | Truck-trailer | Light Loco(s) | 0 | 0 | HOUSTON |
| 5 | 2012 | BEAR BAYOU DRIVE | Pick-up truck | Freight Train | 0 | 1 | CHANNELVIEW |
| 15 | 2012 | RICHEY RD | Automobile | Work Train | 0 | 1 | SPRING |
| 6 | 2012 | PRIVATE | Van | Yard/Switch | 0 | 1 | - |
| 20 | 2012 | HOLMES RD | Pick-up truck | Freight Train | 0 | 0 | HOUSTON |
| 0 | 2012 | CAMPBELL ROAD | Truck-trailer | Freight Train | 0 | 0 | HOUSTON |
| 3 | 2012 | PRIVATE | Truck-trailer | Yard/Switch | 0 | 1 | HOUSTON |
| 0 | 2012 | RANKIN ROAD | Truck-trailer | Freight Train | 0 | 2 | HOUSTON |
| 15 | 2012 | MARKET STREET ROAD | Truck-trailer | Light Loco(s) | 0 | 0 | HOUSTON |
| 10 | 2012 | 66TH ST | Van | Yard/Switch | 0 | 0 | HOUSTON |
| 5 | 2012 | PRIVATE | Truck-trailer | Freight Train | 0 | 0 | HOUSTON |
| 5 | 2012 | C. E. KING ROAD | Automobile | Special MOW Eq | 0 | 1 | HOUSTON |
| 20 | 2012 | WALTON ROAD | Automobile | Yard/Switch | 0 | 0 | HOUSTON |
| 0 | 2012 | SHERWIN STREET | Automobile | Freight Train | 0 | 0 | HOUSTON |
| 0 | 2013 | TELGE ROAD | Truck-trailer | Freight Train | 0 | 1 | CYPRESS |
| 0 | 2013 | SAND CROSSING/DELTA | Truck-trailer | Freight Train | 0 | 0 | HOUSTON |
| 0 | 2013 | PARKER STREET | Automobile | Freight Train | 0 | 0 | HOUSTON |
| 0 | 2013 | PRIVATE CROSSING | Truck-trailer | Freight Train | 0 | 0 | HOUSTON |
| 0 | 2013 | JACINTO BLVD CROSSIN | Truck-trailer | Yard/Switch | 0 | 0 | CHANNELVIEW |
| 0 | 2013 | WESTFIELD LOOP | Truck-trailer | Freight Train | 0 | 0 | SPRING |
| 3 | 2013 | NCG | Automobile | Freight Train | 0 | 2 | HOUSTON |
| 0 | 2013 | BEECHUNT | Automobile | Freight Train | 0 | 1 | HOUSTON |
| 20 | 2013 | HAHLO ST | Truck-trailer | Yard/Switch | 0 | 0 | HOUSTON |
| 0 | 2013 | SAWYER STREET | Truck-trailer | Freight Train | 0 | 0 | HOUSTON |
| 10 | 2013 | ROTHWOOD DR. | Automobile | Special MOW Eq | 0 | 0 | SPRING |
| 10 | 2013 | HARDY ROAD | Automobile | Freight Train | 0 | 0 | SPRING |
| 20 | 2013 | MYKAWA RD | Automobile | Freight Train | 0 | 0 | - |
| 3 | 2013 | QUITMAN | Van | Yard/Switch | 0 | 0 | HOUSTON |
| 25 | 2013 | JACINTOPORT CROSSING | Truck-trailer | Freight Train | 0 | 0 | CHANNELVIEW |
| 5 | 2013 | CARGILL CROSSING | Truck-trailer | Freight Train | 0 | 0 | CHANNELVIEW |
| 4 | 2013 | RAILROAD AVE | Automobile | Yard/Switch | 0 | 0 | BAYTOWN |
| 0 | 2013 | ASHLAND CHEMICALS | Truck-trailer | Freight Train | 0 | 0 | HOUSTON |
| 0 | 2013 | SHERWIN | Truck-trailer | Freight Train | 0 | 0 | HOUSTON |
| 0 | 2013 | WEST LITTLE YORK | Truck-trailer | Freight Train | 0 | 0 | HOUSTON |
| - | 2013 | SAN JACINTO ST. | Truck-trailer | Freight Train | 0 | 0 | HOUSTON |
| 5 | 2013 | KNIGHT RD | Truck-trailer | Freight Train | 0 | 0 | - |
| 0 | 2013 | OIL TANKING E MAIN | Truck-trailer | Freight Train | 0 | 0 | HOUSTON |
| 5 | 2013 | CAVALCADE STREET | Automobile | Freight Train | 0 | 0 | HOUSTON |
| 5 | 2013 | MARKET | Truck-trailer | Yard/Switch | 0 | 0 | - |
| 5 | 2013 | PRIVATE | Truck-trailer | Freight Train | 0 | 0 | HOUSTON |
| 4 | 2013 | PRIVATE | Truck-trailer | Freight Train | 0 | 0 | - |
| 4 | 2013 | LYONDELL CITGO PRIVA | Automobile | Freight Train | 0 | 0 | PASADENA |
| 0 | 2013 | CAMPBELL RD | Pick-up truck | Freight Train | 0 | 0 | HOUSTON |
| 5 | 2013 | PRIVATE | Van | Light Loco(s) | 0 | 0 | HOUSTON |
| 10 | 2013 | CEMEX PRIVATE CROSSI | Truck-trailer | Freight Train | 0 | 0 | MISSOURI CITY |
| 5 | 2013 | 2244 COLLINGSWORTH | Automobile | Freight Train | 0 | 1 | - |
| 0 | 2013 | HAVILAND STREET | Automobile | Freight Train | 0 | 0 | MISSOURI CITY |
| 13 | 2013 | GRIGGS | Automobile | Freight Train | 0 | 0 | - |
| 0 | 2013 | BELLAIRE BLVD. | Automobile | Freight Train | 0 | 0 | HOUSTON |
| 5 | 2013 | CESAR CHAVEZ BLVD | Automobile | Freight Train | 0 | 0 | HOUSTON |
| 0 | 2014 | SO 75TH ST | Pick-up truck | Yard/Switch | 0 | 0 | - |
| 0 | 2014 | FM 0521 S FRNTG | Automobile | Freight Train | 0 | 0 | - |
| 33 | 2014 | HILLCROFT ST | Automobile | Freight Train | 1 | 0 | HOUSTON |
| 60 | 2014 | JACINTOPORT CROSSING | Pick-up truck | Freight Train | 0 | 0 | HOUSTON |
| 10 | 2014 | PVT-PT. OF HOUSTON | Automobile | Yard/Switch | 0 | 1 | HOUSTON |
| 0 | 2014 | W. BELLFORT AVE | Automobile | Freight Train | 0 | 0 | HOUSTON |
| 10 | 2014 | SHELDON RD | Pick-up truck | Yard/Switch | 0 | 0 | - |
| 5 | 2014 | LYONS AVENUE | Automobile | Yard/Switch | 0 | 0 | HOUSTON |
| 0 | 2014 | SILVER STREET | Automobile | Freight Train | 0 | 0 | HOUSTON |
| 10 | 2014 | MARKET STREET ROAD | Truck-trailer | Yard/Switch | 0 | 1 | HOUSTON |
| 2 | 2014 | FIELDS ROAD | Truck-trailer | Freight Train | 0 | 0 | HOUSTON |
| 0 | 2014 | HILLCROFT ST | Automobile | Freight Train | 0 | 2 | HOUSTON |
| 0 | 2014 | BELFORT DRIVE | Automobile | Freight Train | 0 | 0 | HOUSTON |
| 3 | 2014 | PRIVATE | Automobile | Light Loco(s) | 0 | 0 | HOUSTON |
| 5 | 2014 | PRIVATE | Automobile | Light Loco(s) | 0 | 0 | LA PORTE |
| 2 | 2014 | MISSISSIPPI ST | Truck-trailer | Freight Train | 0 | 0 | HOUSTON |
| - | 2014 | RANKIN ROAD | Automobile | Freight Train | 0 | 1 | HOUSTON |
| 26 | 2014 | BLALOCK DRIVE | Automobile | Light Loco(s) | 0 | 0 | HOUSTON |
| 5 | 2014 | HOLMES | Truck-trailer | Freight Train | 0 | 0 | - |
| 0 | 2014 | TIDWELL RD | Automobile | Freight Train | 0 | 0 | - |
| 10 | 2014 | CORONATION DRIVE | Automobile | Freight Train | 0 | 1 | HOUSTON |
| - | 2014 | HIRSCH ROAD | Pedestrian | Freight Train | 0 | 1 | HOUSTON |
| - | 2014 | CAMPBELL ROAD | Truck-trailer | Freight Train | 0 | 0 | HOUSTON |
| - | 2014 | A-Z TERMINAL | Truck-trailer | Freight Train | 0 | 0 | - |
| 10 | 2014 | GATE 8 | Automobile | Light Loco(s) | 0 | 0 | HOUSTON |
| 0 | 2014 | AIRPORT BLVD. | Automobile | Freight Train | 0 | 0 | HOUSTON |
| 0 | 2014 | UP PVT YARD ROAD | Van | Cut of Cars | 0 | 0 | HOUSTON |
| 0 | 2014 | HAVILAND | Pick-up truck | Freight Train | 0 | 0 | HOUSTON |
| 10 | 2014 | TEXAS TERMINAL LEAD | Automobile | Freight Train | 0 | 0 | CHANNELVIEW |
| 10 | 2014 | JACINTOPORT BLVD. LD | Truck-trailer | Light Loco(s) | 0 | 0 | CHANNELVIEW |
| 30 | 2014 | JACINTOPORT BLVD. LD | Truck-trailer | Light Loco(s) | 0 | 0 | CHANNELVIEW |
| 20 | 2014 | HOWARD DRIVE | Pick-up truck | Freight Train | 0 | 0 | HOUSTON |
| 6 | 2014 | CR 6150 | Automobile | Freight Train | 0 | 0 | - |
| - | 2014 | OREM ROAD | Automobile | Freight Train | 0 | 0 | HOUSTON |
| 20 | 2014 | CANAL STREET | Automobile | Freight Train | 0 | 1 | HOUSTON |
| 5 | 2014 | OIL TANKING WEST MAI | Truck-trailer | Freight Train | 0 | 0 | HOUSTON |
| - | 2014 | TIDWELL RD | Automobile | Freight Train | 0 | 4 | - |
| - | 2014 | RANKIN ROAD | Automobile | Freight Train | 0 | 0 | HOUSTON |
| 5 | 2014 | MCFARLAND STREET | Truck-trailer | Freight Train | 0 | 0 | HOUSTON |
| 1 | 2014 | PRIVATE | Truck-trailer | Yard/Switch | 0 | 1 | GALENA PARK |
| 4 | 2014 | KOPMAN DR | Truck-trailer | Yard/Switch | 0 | 0 | HOUSTON |
| - | 2014 | CROSBY-LYNCHBURG | Pedestrian | Freight Train | 0 | 1 | HIGHLANDS |
| 5 | 2014 | ALTIC ST | Automobile | Yard/Switch | 0 | 0 | HOUSTON |
| 0 | 2014 | HILLCROFT STREET | Automobile | Freight Train | 0 | 0 | HOUSTON |
| 5 | 2015 | MAIN ST SHELL PR XNG | Truck-trailer | Freight Train | 0 | 0 | DEER PARK |
| 0 | 2015 | DURHAM ST | Automobile | Freight Train | 0 | 0 | HOUSTON |
| 0 | 2015 | RICHEY ROAD | Truck-trailer | Freight Train | 0 | 0 | SPRING |
| - | 2015 | SHAVER STREET | Automobile | Freight Train | 0 | 0 | HOUSTON |
| 0 | 2015 | KNIGHT ROAD | Automobile | Freight Train | 0 | 0 | - |
| 5 | 2015 | JACINTO BLVD. CROSSI | Truck-trailer | Freight Train | 0 | 0 | CHANNELVIEW |
| 0 | 2015 | CLINTON DRIVE | Automobile | Yard/Switch | 0 | 0 | HOUSTON |
| 0 | 2015 | TRENTHAM PLACE | Automobile | Freight Train | 0 | 0 | HOUSTON |
| - | 2015 | SCOTT STREET | Automobile | Freight Train | 0 | 0 | HOUSTON |
| 10 | 2015 | MARKET STREET | Pick-up truck | Freight Train | 0 | 0 | HOUSTON |
| 10 | 2015 | GATE 8 | Truck-trailer | Freight Train | 0 | 0 | HOUSTON |
| 5 | 2015 | CLAY ROAD | Truck-trailer | Freight Train | 0 | 0 | HOUSTON |
| 0 | 2015 | FONDREN | Automobile | Freight Train | 0 | 0 | HOUSTON |
| 20 | 2015 | ALTIC STREET | Automobile | Freight Train | 0 | 1 | HOUSTON |
| 0 | 2015 | TIDWELL RD | Automobile | Freight Train | 0 | 0 | - |
| - | 2015 | COMMERCE | Pedestrian | Freight Train | 0 | 2 | - |
| 5 | 2015 | PRIVATE PLANT CROSSI | Truck-trailer | Yard/Switch | 0 | 0 | HOUSTON |
| - | 2015 | GRIGGS ROAD | Truck-trailer | Light Loco(s) | 0 | 2 | HOUSTON |
| 5 | 2015 | JENSEN DRIVE | Automobile | Freight Train | 0 | 0 | HOUSTON |
| 0 | 2015 | HUFSMITH-KOHRVILL | Pick-up truck | Freight Train | 0 | 0 | TOMBALL |
| 0 | 2015 | RANKIN ROAD | Automobile | Freight Train | 0 | 0 | SPRING |
| - | 2015 | MAIN | Pedestrian | Freight Train | 0 | 1 | HOUSTON |
| 0 | 2015 | JENSEN DR. | Automobile | Freight Train | 0 | 0 | HOUSTON |
| 10 | 2015 | CARGILL CROSSING | Truck-trailer | Freight Train | 0 | 0 | CHANNELVIEW |
| 0 | 2016 | LONG DR | Truck-trailer | Freight Train | 0 | 0 | HOUSTON |
| 10 | 2016 | MT. HOUSTON ROAD | Automobile | Freight Train | 0 | 2 | HUMBLE |
| - | 2016 | LYONS AVE | Pedestrian | Freight Train | 0 | 0 | HOUSTON |
| 5 | 2016 | OIL TANKING WEST MAI | Automobile | Freight Train | 0 | 0 | HOUSTON |
| 20 | 2016 | FONDREN RD | Automobile | Work Train | 0 | 0 | MISSOURI CITY |
| 15 | 2016 | LAWNDALE | Pick-up truck | Freight Train | 0 | 0 | PASADENA |
| 5 | 2016 | US 59-SOUTHWEST FWY | Automobile | Freight Train | 0 | 0 | BELLAIRE |
| 15 | 2016 | BAY AREA BLVD | Truck-trailer | Freight Train | 0 | 0 | LA PORTE |
| 20 | 2016 | LYONS AVE. | Automobile | Freight Train | 0 | 1 | HOUSTON |
| 10 | 2016 | 5800 LONG ROAD | Automobile | Freight Train | 0 | 1 | HOUSTON |
| - | 2016 | FONDREN ROAD | Automobile | Freight Train | 0 | 0 | HOUSTON |
| 0 | 2016 | KEMPWOOD DR | Pick-up truck | Freight Train | 0 | 0 | HOUSTON |
| 10 | 2016 | LYONS AVE | Pick-up truck | Freight Train | 0 | 0 | HOUSTON |
| 0 | 2016 | LONG STREET | Truck-trailer | Freight Train | 0 | 0 | HOUSTON |
| 19 | 2016 | PARKER ST | Automobile | Freight Train | 0 | 0 | HOUSTON |
| 10 | 2016 | LONG DRIVE | Automobile | Freight Train | 0 | 0 | HOUSTON |
| 0 | 2016 | OIL TANKING EAST MAI | Truck-trailer | Freight Train | 0 | 0 | HOUSTON |
| 3 | 2016 | IN THE YARD | Pick-up truck | Light Loco(s) | 0 | 0 | HOUSTON |
| 0 | 2016 | PRIVATE | Van | Yard/Switch | 0 | 0 | - |
| 5 | 2016 | JACINTO BLVD. CROSSI | Truck-trailer | Cut of Cars | 0 | 0 | HOUSTON |
| 0 | 2016 | RICHEY RD | Truck-trailer | Freight Train | 0 | 0 | SPRING |
There were 150 railroad incidents in Harris County between 2012 – 2016. And there are many other issues, such as derailments, dumping of hazardous materials, and more.
Many trains cross the South Texas and Houston area every day, so it’s important to be aware and stay safe.
– Allstate America’s Best Drivers Report
Now, how are Pasadena’s drivers?
Allstate does a report every year which analyzes driving behavior (and rate of claims) in cities all around the country. They come up with a list of 200 and rank them from best to worst.
| 2019 Best Drivers Report Ranking | Average Years Between Claims | Average Years Between Claims (National AVG) | 2018 Ranking |
|---|---|---|---|
| 86 | 9.3 | 10.57 | 91 |
Pasadena is ranked 86 in 2019, rising five ranks from 91 in 2018.
There is no data about hard-braking incidents, but residents of Pasadena file claims less frequently than the average American by a little over one year.
This is positive in insurance companies’ eyes, because it saves them money.
– Ridesharing
Ridesharing is a popular option for those looking to get around, whether they don’t have a car or they want a night out without having to drive.
For this experiment, we took a hypothetical trip from the San Jacinto Central College to Don’Key’s Mexican Food. These numbers come from RideGuru.
Your options are
- Uber: X $9 | Select $20 | Black $26
- Lyft: Premier $20 | Lux $28
- Arro: $12
- Taxi: $12
Uber and Lyft are active in Pasadena, which is positive for the ridesharing community. Arro and Taxi, two taxi services, are active as well.
– E-star Repair Shops
When you purchase car insurance through Esurance.com, you gain access to its E-star repair shop program, which matches you with high-quality repair shops across the country.
There are 20 repair shops within 50 miles of Pasadena. The top/closest 10 are highlighted here.
| Name of Facility | Address | Contact Information |
|---|---|---|
| CALIBER - CLEARLAKE | 603 GEMINI STREET HOUSTON TX 77058 | email: [email protected] P: (281) 286-1700 F: (972) 906-7164 |
| RUSSELL & SMITH FORD HONDA | 1109 SOUTH LOOP W HOUSTON TX 77054 | email: [email protected] P: (713) 663-4216 F: (713) 663-4110 |
| SERVICE KING PEARLAND | 2330 SMITH RANCH ROAD PEARLAND TX 77584 | email: [email protected] P: (713) 795-3100 F: (800) 214-2373 |
| SERVICE KING BAYTOWN | 4510 N MAIN ST BAYTOWN TX 77520 | email: [email protected] P: (281) 422-2284 F: (800) 214-2373 |
| MILLER AUTO & BODY REPAIR | 4816 N SHEPHERD HOUSTON TX 77018 | email: [email protected] P: (713) 864-7820 F: (713) 864-6280 |
| SERVICE KING GALLERIA | 5919 WESTHEIMER ROAD HOUSTON TX 77057 | email: [email protected] P: (713) 243-1400 F: (713) 266-4316 |
| CARSTAR PREMIER | 9520 RICHMOND AVE HOUSTON TX 77063 | email: [email protected] P: (713) 952-3777 |
| SERVICE KING SOUTHWEST FREEWAY | 10475 SOUTHWEST FREEWAY HOUSTON TX 77074 | email: [email protected] P: (713) 773-5000 F: (713) 772-1746 |
| CHARLTON'S BODY REPAIR_CF | 1131 STAFFORDSHIRE RD STAFFORD TX 77477 | email: [email protected] P: (281) 499-1126 F: (281) 499-1694 |
| SERVICE KING HUMBLE | 450 E FM 1960 HUMBLE TX 77338 | email: [email protected] P: (281) 446-6660 F: (800) 214-2373 |
With the E-star program, you receive daily updates about the work they’re doing on your car, including pictures of the progress.
– Weather
The climate in Pasadena is characterized by hot, humid summers and mild winters.
| Temperature Facts | Details |
|---|---|
| Annual High | 78.3°F |
| Annual Low | 59.8°F |
| Average Temperature | 69.05°F |
The annual high and the annual low are not separated by a huge amount — only around 19 degrees. The average temperature is a balmy 70 degrees.
| Weather Facts | Details |
|---|---|
| Average Sunshine | 206 days |
| Average Annual Rainfall | 45.28 inches |
Pasadena gets a fair amount of sunshine each year, with a little over half the year having sunshine. At 45 inches, there is also a good amount of rain.
While the weather is amenable in Pasadena, there are a high number of natural disasters.
The number of natural disasters in Harris County — 29 — is a lot greater than the U.S. average of 13. A sitting president has declared 22 of these as major disasters and six as emergencies.
The causes are varied but focus on storms:
- Storms: 16
- Floods: 15
- Hurricanes: 8
- Tornadoes: 7
- Tropical Storms: 3
- Fires: 2
- Winds: 2
Some of these disasters can be assigned to multiple categories, which is why the total number is higher than 29.
– Public Transit
It appears Pasadena residents are without public transit. According to Houston Public Media, there was a plan to revive the bus routes in Pasadena after they were canceled in 2012.
However, according to the Houston Chronicle, that plan was stalled in December of 2017, and there’s no evidence of Pasadena bus routes on the Harris County Transit website.
This is in line with our research showing almost no people in Pasadena used public transportation.
– Alternate Transportation
There is also no evidence that neighborhood-to-neighborhood transportation, like Bird and Lime, is in Pasadena either.
And, if you want to try an electric scooter, you won’t find them in Houston.
– Parking in Metro Areas
There is very little data on parking in Pasadena. However, if it is like other cities, there are numerous spots for off-street and garage parking, likely to be paid with cash or card.
– Air Quality in Pasadena
Air quality is important, as air pollution, smog, and hazardous substances can cause problems for people with respiratory conditions and lead to problems for others.
The Environmental Protection Agency lists six major air pollutants, including carbon monoxide, sulfur dioxide, and lead. As they write,
These pollutants are found all over the U.S. They can harm your health and the environment, and cause property damage.
Now, what is and has been the air quality in the Houston metroplex?
| YEAR | DAYS WITH AQI | GOOD DAYS | MODERATE DAYS | UNHEALTHY DAYS FOR SENSITIVE GROUPS | UNHEALTHY DAYS | VERY UNHEALTHY DAYS |
|---|---|---|---|---|---|---|
| 2016 | 366 | 164 | 179 | 22 | 1 | 0 |
| 2017 | 365 | 184 | 156 | 22 | 3 | 0 |
| 2018 | 365 | 166 | 164 | 26 | 7 | 2 |
Compared to some other cities, not very positive. The Houston metroplex has had a high amount of unhealthy days for sensitive groups, like those with asthma, and there have been some unhealthy days in general.
The trend is not positive, with more unhealthy days coming in 2018 than any other, including two very unhealthy days. Hopefully, Houston can turn it around. Air pollution taken to the extreme doesn’t look (or feel) pretty.
Military/Veterans
Being a military service member can be stressful, with the long hours, the detailed work, and the possibility of being deployed. But you know what shouldn’t be stressful?
Finding your car insurance.
We, here at TexasCarInsurance.com understand this and have made this section strictly for military personnel, their families, and those who want to learn more. It covers everything from the make-up of veterans in Pasadena to the rates of USAA compared to other providers.
Hoo-hah.
– Veterans by Service Period
Texas is a state heavy on military bases, so it may seem unsurprising a good amount of veterans in Texas are from the second Gulf War. Do the statistics back that up?
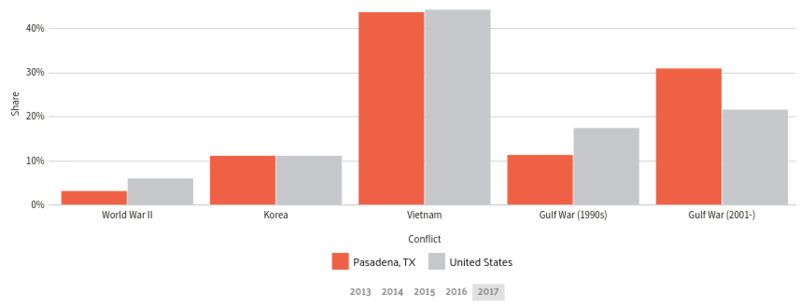
Pasadena veterans are similar to the national ratio with respect to Vietnam and the Korean War, but that’s where the similarities end.
A higher percentage of veterans in Pasadena are from the second Gulf War (2001 – present) and a lower percentage of veterans from the first Gulf War or World War II.
This is likely due to Texas being a state with a high number of military bases. Veterans might often settle around the base where they were trained and met their significant other.
– Military Bases Within an Hour
There is one base so close to Pasadena, it’s within a morning’s commute: the Ellington Field Joint Reserve Base in Houston.
This base houses the Texas Air National Guard 147th Reconnaissance Wing and serves as a defense and homeland security compound. It is also part of the Ellington Airport.
As its MilitaryBases.us writes,
Ellington Field JRB is notable for having troop presences from all five of the U.S. Armed Forces: Army, Navy, Marines, Air Force and Coast Guard.
It was built in 1917 and served through many wars, including World War I.
– Military Discounts by Providers
There is only one provider who offers a discount for active and retired service members in Pasadena — Geico — though Nationwide is hoping to add one soon.
– USAA Available in Texas
While there are not many discounts for military personnel from major companies, active, reserve, and retired service members have an option no one else does: USAA.
USAA was started by 25 servicemembers in 1922 in San Antonio, Texas, because companies believed that being military personnel was too high-risk for basic insurance.
Today, they offer some of the cheapest rates in the country, backed by great customer satisfaction, according to J.D. Power’s annual study.
In Pasadena, they remain the most affordable option, well below the premium when all companies are averaged, and even further below the most expensive company.
| Group | Average Premium | Difference (+/-) | Difference (%) |
|---|---|---|---|
| Allstate | $5,485.44 | $1,442.16 | 35.67% |
| American Family | $4,848.72 | $805.44 | 19.92% |
| GEICO | $3,263.28 | -$780.00 | -19.29% |
| Nationwide | $3,867.55 | -$175.73 | -4.35% |
| Progressive | $4,664.69 | $621.41 | 15.37% |
| State Farm | $2,879.94 | -$1,163.34 | -28.77% |
| USAA | $2,487.89 | -$1,555.39 | -38.47% |
The average USAA premium in Texas costs around $2,500, making it over $1,500 less than the average for all companies and about $3,000 less than Allstate.
USAA allows military personnel to add their children and their spouse, as well.
Unique City Laws
Every city has unique laws, some of them strange, some weird, some of them out of the 1800s.
In this section, we’ll take a look at four subsets of laws that affect good portions (or all) of the population in Pasadena.
Bear with us, we know this is a lot. We’re nearing the finish line.
– Hands-Free Laws
In 2017, Governor Greg Abbott signed a bill called HB 62.
This bill, not the first of its kind, banned the reading, writing, and sending of electronic messages with a wireless device while operating a vehicle, except in an emergency.
It went into effect in September 2017, but there were issues; the language in the document left open loopholes, rendering the bill inert.
Some lawmakers acknowledged this.
However, it remains Texas’s only law regulating wireless communications in cars. Some other highlights of the bill include that it bans anyone under 18 is from any wireless use.
And that all wireless use is prohibited for school zones.
Pasadena has doubled down on this last, issuing its own ordinance banning the use of handheld communication devices in school zones. This applies during normal school days and hours and the lights are flashing.
Handheld communication devices are permitted in the event of an emergency.
– Food Trucks
Everyone loves a good food truck, and in this holds in the Greater Houston area, where they’ve hosted a large food truck festival for two years running.
In Pasadena, there are laws regulating food trucks, from permits to how to dispose of waste. Here are a few from the city code (though they’re referred to there as mobile food service units).
First, there is a definition:
Mobile food service unit means a vehicle-mounted food service establishment designed to be readily movable which does not serve frozen dessert products.
Permits:
All food establishments in the city are required to obtain the proper permit or permits for such establishments. Such fees are set forth as follows: … Mobile food service unit permit, per year ….. 100.00
And how to dispense of flammable liquids:
All Class I flammable liquids shall be stored, handled, and/or dispensed from approved underground tanks, through approved pumping equipment.
There are certainly others; if you’re interested, check out the city code for more information.
– Tiny Homes
When it comes to building a tiny home (or as Texas likes to call them — accessory dwelling units), there are no specific laws in Pasadena’s code.
Generally, building a tiny home comes down to zoning regulations; they’re often permitted, but need to stay within the correct zone (R-1 being a hypothetical example).
If you’re interested in building one, it can help to go through the city code. If, like Pasadena, there don’t seem to be any specific laws, it can help to phone your city councilor.
There are tiny home communities in Texas, so it is certainly possible.
– Parking Laws
Tiny home laws may be sparse, but in Pasadena, like many other cities, parking laws are a must. Here are some from the city code.
On parallel parking:
Every vehicle parked on any street in the city shall be parked parallel with the edge of the roadway, headed in the direction of traffic, and with the curb-side wheels of the vehicle within eighteen (18) inches of the curb or edge of the roadway.
On parking in an alley:
No person shall park a vehicle within an alley in such a manner or under such conditions as to leave available less than ten (10) feet of the width of the roadway for the free movement of vehicular traffic.
On parking longer than 24 hours:
It shall be unlawful for any person to park or leave standing in any public street, alley or other public place any vehicle for a longer continuous period of time than twenty-four (24) hours.
There are many more, as well.
Pasadena Car Insurance FAQs
– What happens if I get into an accident in Pasadena?
Texas is considered an at-fault state, meaning that whoever is determined to be at-fault in an accident (which is usually done by the police officer on the scene), they are held liable for all property damage and any medical bills of the other driver or their passengers. For more information, check out our Texas car insurance guide.
– Do I need to learn a second language to live in Pasadena?
Over 60 percent of the population in Pasadena is Hispanic, so Spanish is likely spoken more frequently in Pasadena than in many other American cities. You may not have to learn it for the day-to-day, but it might help when you’re encountering someone who doesn’t speak English very well. It can be like McAllen, Texas, in that regard.
– What is the minimum car insurance coverage in Pasadena?
Minimum coverage in Texas is 30/60/25, meaning $30,000 for the injuries of one person, $60,000 of the injuries of more than one person, $25,000 for property damage. These coverages are considered liability insurance and are the bare minimum; you might want to carry more in the event of a serious accident.
– How do I get insurance if I’m a high-risk driver in Pasadena?
If you’re a high-risk driver, you may be required to get an SR-22, which is a form of financial responsibility (proof you have insurance). Insurance companies issue these, but if you have no luck with them, you can try the Texas Automobile Insurance Plan Association. They are a last-ditch market for high-risk drivers and insurance companies.
– What is the cost of living in Pasadena?
According to PayScale, the cost of living in Pasadena is less than the United States average by about 7 percent. People living in Pasadena save money on housing and groceries but pay more for utilities. According to AreaVibes, prices are generally cheaper in Pasadena, with an appointment to a doctor costing $80.33 without insurance and a sack of potatoes costing $2.61.
That’s it! You’re done. Now you should have enough information to make an informed decision about car insurance in Pasadena, Texas.
Clear eyes, full hearts. Happy driving.
Ready to compare rates? Try our FREE online tool!