


| Houston, Texas Statistics | |
|---|---|
| City Population | 2,304,388 |
| City Density | 3,977 people per square mile |
| Average Cost of Insurance | $3,018.83 |
| Cheapest Car Insurance Company | USAA |
| Road Conditions | Poor Share: 24% Mediocre Share: 28% Fair Share: 11% Good Share: 38% Vehicle Operating Cost (VOC): $610 |
In the state where everything is supposedly bigger, it’s certainly true in Houston, Texas! It is the most populated city in the state and is also in the top-five most populated cities in the entire United States. Yowza!
With all of these people come a lot of drivers, and a lot of traffic on the roads. So how exactly are you supposed to navigate these roads and streets in the big city?
Well, we’ve gone through all the trouble for you, and have made this comprehensive guide to help you figure out the basis of all of your driving, your car insurance! That’s right, without car insurance, you can’t drive. So making sure you have that squared away in the Lone Star State is vital!
Let’s get to comparing that Houston car insurance, deep in the heart of Texas!
Table of Contents
The Cost of Car Insurance in Houston
There are so many different factors that can affect what your car insurance rate will be that it’s almost mind-boggling! Even things you wouldn’t even think to consider can affect it, from where exactly you live in your state, your marital status, your driving record, how far you drive for your commute typically, and more.
In this section, we’ve broken up some of the different factors that can contribute to the cost of your car insurance for those of you living in Houston, Texas.
– Demographics of Houston
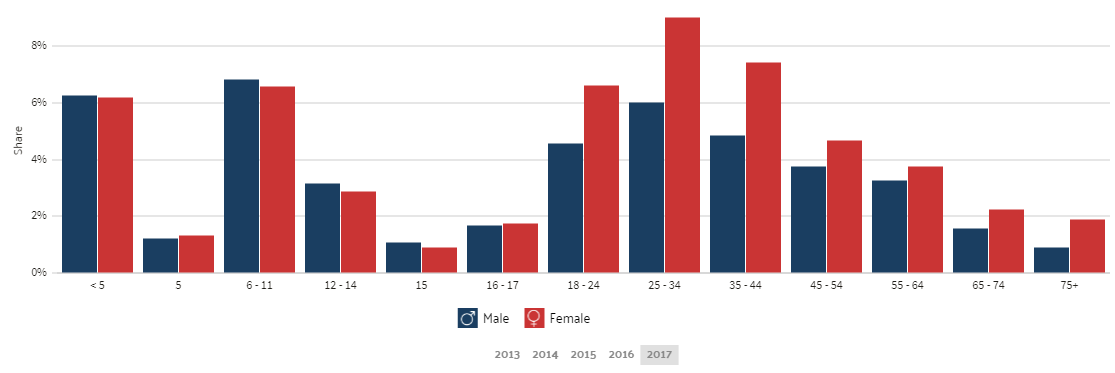
Did you know that your gender and age can affect what car insurance rate you are given? Unfortunately, such is the case across most states in the nation.
The median age of Houston, TX citizens is 33.1 years old.
On average, Houston male citizens are paying approximately $4,770.73 annually for their car insurance, while female Houston citizens are only paying $4,500.91.
We further broke this down to see how this is divided by the various car insurance providers.
| Group | Married 35-year old female | Married 35-year old male | Married 60-year old female | Married 60-year old male | Single 17-year old female | Single 17-year old male | Single 25-year old female | Single 25-year old male | Average |
|---|---|---|---|---|---|---|---|---|---|
| Allstate | $4,217.27 | $4,244.40 | $4,163.30 | $4,163.30 | $11,218.58 | $13,508.79 | $5,202.14 | $5,400.52 | $6,514.79 |
| American Family | $3,868.87 | $4,362.69 | $3,710.26 | $4,306.92 | $11,317.80 | $14,803.09 | $5,781.26 | $6,621.66 | $6,846.57 |
| GEICO | $2,912.28 | $3,169.25 | $2,838.28 | $3,271.55 | $6,541.74 | $6,741.68 | $3,158.48 | $3,120.96 | $3,969.28 |
| Nationwide | $2,737.94 | $2,781.67 | $2,414.89 | $2,556.62 | $7,905.73 | $10,151.58 | $3,231.22 | $3,497.33 | $4,409.62 |
| Progressive | $2,780.15 | $2,646.22 | $2,470.71 | $2,516.22 | $11,780.27 | $13,178.71 | $3,311.60 | $3,372.89 | $5,257.10 |
| State Farm | $2,409.57 | $2,409.57 | $2,150.86 | $2,150.86 | $5,837.21 | $7,446.90 | $2,624.53 | $2,699.21 | $3,466.09 |
| USAA | $1,861.20 | $1,862.59 | $1,788.73 | $1,764.79 | $5,316.68 | $5,756.42 | $2,474.00 | $2,628.93 | $2,931.67 |
Age and gender can play a pretty large role in what you’re going to pay for your car insurance. Married females tend to pay less for their insurance, while younger and single males tend to pay the most for theirs.
– Cheapest Zip Codes in Houston
What part of Houston you live in can also play a factor in what rate you will see. Check out the table below to find your zip code to see what your average rate is.
| Zip | Average Annual Rate |
|---|---|
| 77059 | $6,254.85 |
| 77062 | $6,263.54 |
| 77058 | $6,308.38 |
| 77339 | $6,351.62 |
| 77079 | $6,441.61 |
| 77005 | $6,459.12 |
| 77094 | $6,513.47 |
| 77598 | $6,523.91 |
| 77336 | $6,538.79 |
| 77006 | $6,550.05 |
| 77098 | $6,594.26 |
| 77069 | $6,608.68 |
| 77046 | $6,623.26 |
| 77070 | $6,655.34 |
| 77025 | $6,664.14 |
| 77089 | $6,714.46 |
| 77007 | $6,724.72 |
| 77027 | $6,740.78 |
| 77056 | $6,743.45 |
| 77030 | $6,751.63 |
| 77024 | $6,766.97 |
| 77018 | $6,787.86 |
| 77489 | $6,794.35 |
| 77064 | $6,795.54 |
| 77068 | $6,797.24 |
| 77096 | $6,824.63 |
| 77095 | $6,824.84 |
| 77043 | $6,824.99 |
| 77015 | $6,843.82 |
| 77054 | $6,843.85 |
| 77338 | $6,847.41 |
| 77077 | $6,852.84 |
| 77019 | $6,856.66 |
| 77049 | $6,872.59 |
| 77008 | $6,881.81 |
| 77009 | $6,915.07 |
| 77055 | $6,931.67 |
| 77031 | $6,939.89 |
| 77080 | $6,946.18 |
| 77092 | $6,950.09 |
| 77063 | $6,965.40 |
| 77034 | $6,970.03 |
| 77041 | $6,970.77 |
| 77002 | $6,994.51 |
| 77057 | $7,042.73 |
| 77065 | $7,044.17 |
| 77029 | $7,052.00 |
| 77035 | $7,053.81 |
| 77085 | $7,102.58 |
| 77084 | $7,112.24 |
| 77042 | $7,117.06 |
| 77021 | $7,149.81 |
| 77075 | $7,189.45 |
| 77044 | $7,214.79 |
| 77010 | $7,224.35 |
| 77082 | $7,227.39 |
| 77013 | $7,229.21 |
| 77032 | $7,242.29 |
| 77066 | $7,257.08 |
| 77011 | $7,286.14 |
| 77003 | $7,313.08 |
| 77071 | $7,325.02 |
| 77073 | $7,327.59 |
| 77087 | $7,329.81 |
| 77074 | $7,337.34 |
| 77040 | $7,345.76 |
| 77012 | $7,347.90 |
| 77047 | $7,389.06 |
| 77023 | $7,399.43 |
| 77014 | $7,408.80 |
| 77045 | $7,420.16 |
| 77017 | $7,427.19 |
| 77090 | $7,441.20 |
| 77086 | $7,471.65 |
| 77061 | $7,479.15 |
| 77048 | $7,486.87 |
| 77051 | $7,489.43 |
| 77201 | $7,492.29 |
| 77204 | $7,496.11 |
| 77004 | $7,497.22 |
| 77050 | $7,505.14 |
| 77020 | $7,514.53 |
| 77026 | $7,553.90 |
| 77038 | $7,567.20 |
| 77028 | $7,579.76 |
| 77093 | $7,592.70 |
| 77099 | $7,600.09 |
| 77039 | $7,601.85 |
| 77022 | $7,605.82 |
| 77081 | $7,609.75 |
| 77088 | $7,612.47 |
| 77067 | $7,613.31 |
| 77016 | $7,629.02 |
| 77091 | $7,644.01 |
| 77060 | $7,664.73 |
| 77037 | $7,670.41 |
| 77083 | $7,670.98 |
| 77076 | $7,684.94 |
| 77078 | $7,700.94 |
| 77053 | $7,747.72 |
| 77033 | $7,840.97 |
| 77072 | $7,909.04 |
| 77036 | $8,150.71 |
– What’s the Best Car Insurance Company in Houston?
Who is going to give you the absolute best coverage for your money? The best bang for your buck, so to speak. Well, we’ve gone through and compared all of the different available car insurance companies in the Houston, Texas area to help you decide that for yourself.
– Texas Car Insurance Rates by Company
We’ve gone through and listed the average cost of each major insurance provider in the Houston area for your convenience.
| Car Insurance Provider | Average Cost of Insurance |
|---|---|
| Allstate | $6,514.79 |
| American Family | $6,846.57 |
| GEICO | $3,969.28 |
| Nationwide | $4,409.62 |
| Progressive | $5,257.10 |
| State Farm | $3,466.09 |
| USAA | $2,931.67 |
So those in Houston can expect to find that USAA would be the cheapest insurance provider in the Houston area, but that is highly dependent on other factors as well.
Seeing the differences between each of the providers above, you can definitely see why shopping around for your car insurance can save you some extra cash!
– Best Car Insurance for Commute Rates
How far you drive can sometimes contribute to what rates you are given. Typically, the further you drive, the more expensive your car insurance is going to be.
| Insurance Provider | 10 miles commute / 6000 annual mileage. | 25 miles commute / 12000 annual mileage. | Average |
|---|---|---|---|
| Allstate | $6,353.51 | $6,676.06 | $6,514.79 |
| American Family | $6,846.57 | $6,846.57 | $6,846.57 |
| GEICO | $3,895.17 | $4,043.38 | $3,969.28 |
| Nationwide | $4,409.62 | $4,409.62 | $4,409.62 |
| Progressive | $5,257.10 | $5,257.10 | $5,257.10 |
| State Farm | $3,466.09 | $3,466.09 | $3,466.09 |
| USAA | $2,894.35 | $2,968.99 | $2,931.67 |
Some insurance providers charge more money for having a longer commute, such as Allstate or American Family. Other providers, however, offer comparable (or less than a one hundred dollar difference) in their policy despite your commutes such as State Farm or Nationwide.
– Best Car Insurance for Coverage Level Rates
Did you know that a few extra bucks can lead to better protection for yourself?
| Insurance Provider | High | Medium | Low | Average |
|---|---|---|---|---|
| Allstate | $6,747.80 | $6,451.07 | $6,345.48 | $6,514.78 |
| American Family | $7,693.82 | $6,550.06 | $6,295.82 | $6,846.57 |
| GEICO | $4,275.87 | $3,908.95 | $3,723.01 | $3,969.28 |
| Nationwide | $4,269.74 | $4,219.83 | $4,739.31 | $4,409.63 |
| Progressive | $5,526.99 | $5,234.74 | $5,009.56 | $5,257.10 |
| State Farm | $3,675.87 | $3,453.47 | $3,268.93 | $3,466.09 |
| USAA | $3,063.36 | $2,917.54 | $2,814.10 | $2,931.67 |
By shopping around to the different insurance providers in Houston, you could find that you could get a better protection plan for yourself for only slightly more, or even LESS than another provider.
USAA for instance only charges $3,063.36 for a high coverage plan, while State Farm charges $3,453.47 for a low coverage plan. Making sure you compare prices amongst the different car insurance providers will be your best bet as to getting the most for your money.
– Best Car Insurance for Credit History Rates
Not surprisingly, your credit history plays a massive role in what kind of insurance coverage you can get. The better your credit history, the better your rate will be, and vice versa.
| Insurance Provider | Good Credit | Fair Credit | Poor Credit | Average |
|---|---|---|---|---|
| Allstate | $5,193.73 | $6,064.69 | $8,285.94 | $6,514.79 |
| American Family | $5,253.86 | $6,015.71 | $9,270.13 | $6,846.57 |
| GEICO | $2,293.67 | $3,462.39 | $6,151.78 | $3,969.28 |
| Nationwide | $3,684.52 | $4,248.38 | $5,295.97 | $4,409.62 |
| Progressive | $4,736.52 | $5,113.92 | $5,920.85 | $5,257.10 |
| State Farm | $2,439.19 | $3,057.10 | $4,901.97 | $3,466.09 |
| USAA | $2,013.20 | $2,496.22 | $4,285.58 | $2,931.67 |
Having a poor credit history could mean thousands of extra dollars for your car insurance. Allstate, American Family, Geico, Nationwide, State Farm, and USAA insurance rates all increase significantly with a poor credit rating as opposed to a good or fair credit rating.
– Best Car Insurance for Driving Record Rates
Feel like you’re a good driver? Then you will have no problem getting the less expensive car insurance rates in Houston! The more traffic offenses and accidents you have on your record, the more you start paying to get the coverage you need.
| Group | Clean record | With 1 accident | With 1 DUI | With 1 speeding violation | Average |
|---|---|---|---|---|---|
| Allstate | $5,026.59 | $7,838.42 | $8,167.54 | $5,026.59 | $7,010.85 |
| American Family | $6,204.20 | $7,997.66 | $6,980.21 | $6,204.20 | $7,060.69 |
| GEICO | $3,360.70 | $4,480.89 | $3,696.17 | $4,339.34 | $3,845.92 |
| Nationwide | $3,820.09 | $3,820.09 | $5,678.74 | $4,319.57 | $4,439.64 |
| Progressive | $4,576.28 | $5,935.65 | $5,356.54 | $5,159.92 | $5,289.49 |
| State Farm | $3,071.33 | $3,533.51 | $4,188.19 | $3,071.33 | $3,597.68 |
| USAA | $2,174.69 | $3,238.80 | $3,814.31 | $2,498.87 | $3,075.93 |
Being a safe driver and a clean driving record is the most sure-fire way of getting the best car insurance rate you can. Getting just one speeding violation could increase your insurance rate dramatically.
Drive safe and keep your eyes on the road to keep your hard earned money where it belongs, in your wallet.
– Car Insurance Factors in Houston
As mentioned previously, Houston is a MASSIVE city, and because of this, there are many factors that are specifically unique to Houston. Such factors include how quickly the city is growing, the median household income, the education level, and more.
We’ve gone through and broken down some of these factors for you to help you understand exactly what all goes into a car insurance quote.
– Metro Report – Growth and Prosperity
When a city is doing well economically, it makes sense that it would bring in more people. Houston is one such city that has been doing pretty well the past few years, economically speaking. In this section, we’re going to hone in on Houston’s growth and prosperity.
What exactly is prosperity? According to Brooking’s Metro Monitor, prosperity is defined as:
“Prosperity captures changes in the average wealth and income produced by an economy. When a metropolitan area grows by increasing the productivity of its workers, through innovation or by upgrading workers’ skills, for example, the value of those workers’ labor rises. As the value of labor rises, so can wages. Increases in productivity and wages are what ultimately improve living standards for workers and families and the competitiveness of metropolitan economies.”
Growth in the Houston area is as follows:
- Jobs: +25.7% (3rd of 100)
- Gross Metropolitan Product (GMP): +47.4% (3rd of 100)
- Jobs at Young Firms: +12.7% (4th of 100)
Houston’s overall rank on growth is 2nd in the nation!
This data means that the job market in Houston is growing at a rather large rate, meaning more opportunities are becoming available for job seekers.
Prosperity in Houston looks a little something like this:
- Productivity: +17.2 percent (4th of 100)
- Standard of Living: +15.9 percent (4th of 100)
- Average Annual Wage: +18.4 percent (4th of 100)
Houston’s overall rank on prosperity is third in the nation.
What in the world does all of this information on prosperity mean? Well, in short, Houston is booming and more people want to move here. If the standard of living is increasing, as are the average annual wages, who wouldn’t want to come?
– Median Household Income
Since Houston has been a booming marketplace for growth and prosperity, it would make sense for the average household income to be fairly robust.
Houston’s median household income is $50,896.
The current median annual income in the nation is $60,336, so Houston is still under the national average. This shouldn’t discourage you, however, as the median income in 2016 was $47,793, a 6.49 percent annual growth. So while the median household income is under the current national average, it’s slowly creeping its way up.
Want to compare your insurance as a percentage of your income? Use the calculator below to get started.
– Homeownership in Houston
Do you own your own home? Maybe you rent an apartment? Whatever your living situation may be, it can affect what car insurance rate you are offered.
A lot of companies prefer homeowners when it comes to car insurance, as they are typically stereotyped as being more responsible than someone who is renting.
In addition to this, a lot of major insurance providers (Geico, Allstate, Progressive, etc.) offer car insurance discounts to those individuals who do own their own home. Why is that?
Well did you know a lot of these places ALSO offer homeowners insurance? Pretty convenient transition for someone who is also in the market for homeowners insurance, isn’t it?
Now let’s take a look at Houston’s homeownership levels.
In 2017, 42.8 percent of individuals in Houston owned their own homes. This is down from 2016 in which 43.1 percent of individuals in Houston owned their own home.
In such a large city though, this level of home ownership makes sense, right? If you’re a young individual working in the city, it makes more sense to rent an apartment close to your job than to own a home and have to commute a long distance.
The national average of home ownership is 63.9 percent, so Houston still has a long way to go on this front.
As there are fewer people who own homes, how much exactly is the property value in Houston? Well, if you’re in the market to pay a home, Houston is the place to be!
The median property value in Houston, TX grew to $173,600 from the previous year’s value of $163,700.
This is pretty encouraging to those looking to make Houston a permanent home, as buying property currently is much lower than the national average, which currently is in the $200,000 to $300,000 range.
– Education in Houston
Let us now educate ourselves, on the education in Houston!
Located conveniently in Houston itself is the University of Houston, Houston Community College, and the University of Houston-Downtown. There are many educational opportunities in the ever-growing city and is proven to have many educated individuals running the roads.
You may be asking, what are the most common concentrations in education? Well, we’ve gone through and listed all of them for you in the table below.
| Education Level | Most (#1) Common Concentration | Number of Degrees Awarded | Second Most Common Concentration | Number of Degrees Awarded | Third Most Common Concentration | Number of Degrees Awarded |
|---|---|---|---|---|---|---|
| <1 Year Postsecondary Certificate | Quality Control and Safety Technology | 202 | Dental Assisting | 194 | Welding Technology | 308 |
| 1-2 Year Postsecondary Certificate | General Costmetology | 438 | Dental Assisting | 373 | Medical Assistant | 1,814 |
| Associates Degree | General Business Administration & Management | 254 | Registered Nursing | 147 | General Sutides | 5,048 |
| 2-4 Year Post-secondary Certificate | Diesel Mechanics Technology | 202 | Auto-body & Collision Repair Technology | 156 | Automobile Mechanics Technology | 544 |
| Bachelor's Degree | General Psychology | 825 | General Business Administration & Management | 772 | Other Multidisciplinary Studies | 909 |
| Post-baccalaureate Certificate | General Business Administration & Management | 216 | Other Theology & Religious Vocations | 0 | N/A | N/A |
| Masters Degree | General Business Administration & Management | 1,133 | Accounting | 206 | Curriculum & Instruction | 202 |
| Post-Masters Certificate | Orthodontics | 7 | Maxillofacial Surgery | 6 | Endodontics | 5 |
| Research Doctorate | General Education Leadership & Administration | 62 | General Chemistry | 49 | Bio-engineering & Biomedical Engineering | 37 |
| Professional Doctorate | Law | 739 | Medicine | 423 | Pharmacy | 199 |
Houston certainly is an educated group.
– Wage by Race & Ethnicity in Common Jobs

– Wage by Gender in Common Jobs

– Poverty by Age and Gener
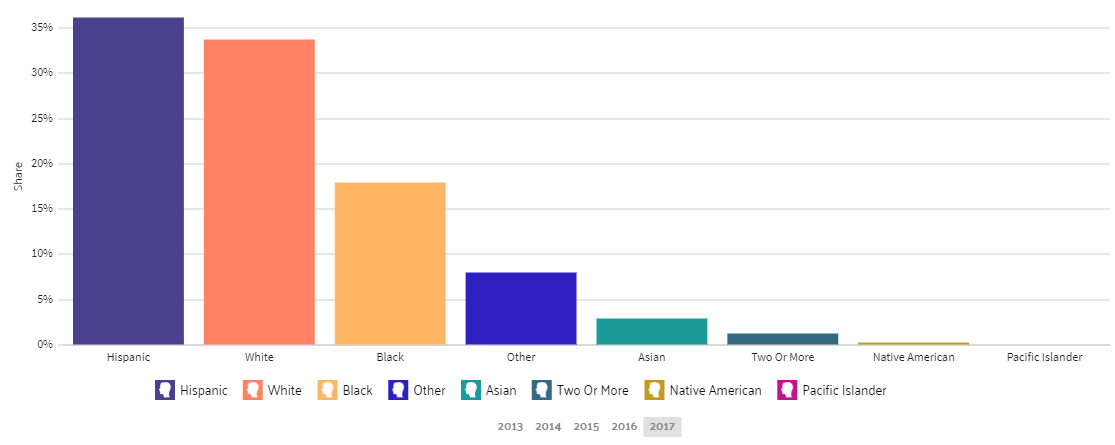
– Poverty by Race and Ethnicity
– Employment by Occupations
Despite having a booming growth period, employment by particular occupations is becoming a little more narrow in the Houston area.
The employment rate in Houston declined from 2016 to 2017 at a rate of -1.48 percent from 1.12 million employees to 1.12 million employees.
Driving in Houston
Now we mentioned at the beginning of this guide just how BIG of a city Houston is.
Did you know that Houston’s land area is a whooping 579.4 square miles? That’s about the size of Oahu.
In such a large city, knowing what kind of roads you’re up against is only going to help you down the line. In this section, we’ve broken down the different road types and driving conditions in Houston.
– Roads in Houston
What are some of the major roads in Houston that you’ll need to know about? We’ll explore that further in this section.
– Major Highways
In order to know what the major highways in Houston are like, you need to know the general lay of the land for Texas.
| Active Routes in Texas | Total Miles in Texas | Major Highway Routes in Texas |
|---|---|---|
| 25 | 3,501.15 miles | I-2, I-10, I-14, I-20, I-27, I-30, I-35, I-35E, I-35W, I-37, I-40, I-44, I-45, I-69 I-110, I-410, I-610, I-820, I-635, I-345, I-69C, I-69E, I-69W, I-169, I-369 |
That’s a lot of highways! Of these highways, which are the ones you’ll want to focus on for living in Houston?
| Name of Route | West End / East End | Branch Routes | Total Mileage | Texas Cities it Passes through |
|---|---|---|---|---|
| I-10 | West End - Santa Monica, CA East End- Jacksonville, FL | 12 | 2,460.34 | El Paso, Fort Stockton, Kerrville, San Antonio, Houston, Beaumont, Orange |
| I-45 | West End - Dallas, TX East End- Galveston, TX | 1 | 284.1 | Galveston, Texas City, Houston, Huntsville, Corsicana, Ennis, Dallas |
| I-69 | West End - Port Huron, MI East End- Indianapolis, IN | 5 | 700.78 | Corpus Christi, Houston, Humble, Stafford, Sugar Land |
| I-610 | West End - Houston, TX East End- Houston, TX | N/A | 37.97 | Houston, Bellaire, Jacinto City, Galena Park |
The biggest highway Houston citizens will all likely become very familiar with is I-610. It’s often called the Loop or the 610 Loop, it consists of the inner beltway within the city of Houston itself.
– Popular Attractions
Houston is a hotspot for my tourist attractions, as one of the largest cities in the entire Lone Star State. Check out the video below for some of the most popular in the city.
– Road Conditions
Are the roads in Houston nice? Or should you expect to find a lot of potholes on your journey through the city?
| Houston Road Conditions | Details |
|---|---|
| Poor Share | 24% |
| Mediocre Share | 28% |
| Fair Share | 11% |
| Good Share | 38% |
| Vehicle Operating Costs (VOC) | $610 |
Fortunately, the majority of roads in Houston are in good or fair conditions. So you can expect to have a relatively smooth trip.
– Does Houston use Speeding or Red Light Cameras?
Houston does not have red light cameras nor speed cameras luckily!
– Vehicles in Houston
What types of vehicles should you expect in Houston? Is it like what you see in television shows and movies about Texas vehicles always being massive trucks? Or is there a larger population of eco-friendly vehicles commonly seen in larger cities these days.
In this section, we’ll dive into the vehicles in Houston, about the most popular vehicles owned all the way to how many vehicles are stolen in the area.
– Most Popular Vehicles Owned
Are there some vehicles that are more popular than others? Does it have to do with the location and terrain of the area? Or maybe it’s the ‘wow’ factor that drivers are looking for to impress their neighbors.
Well, like in most cities, there are indeed vehicles that are more popular in the Houston area. Some of the statistics below were found about some of the most popular cars in major American cities that were quite interesting:
- 47 percent of cars owned in Houston are American-made vehicles.
- The most unusually popular vehicle in Houston is the Ford F-250 Super Duty.
- Approximately 0.7 percent of vehicles are hybrids.
- Muscle cars make up 18.5 percent of the vehicle population in Houston
- There is a 0.5 percent population of Subarus in the Houston area
So from the statistics below it must be true that everything is bigger in Texas. At least that’s true for a majority of vehicles in Houston.
– Cars per Household
Did you know that most American households own at least two vehicles? Houston is a prime example of this, with an average of two vehicles per household.
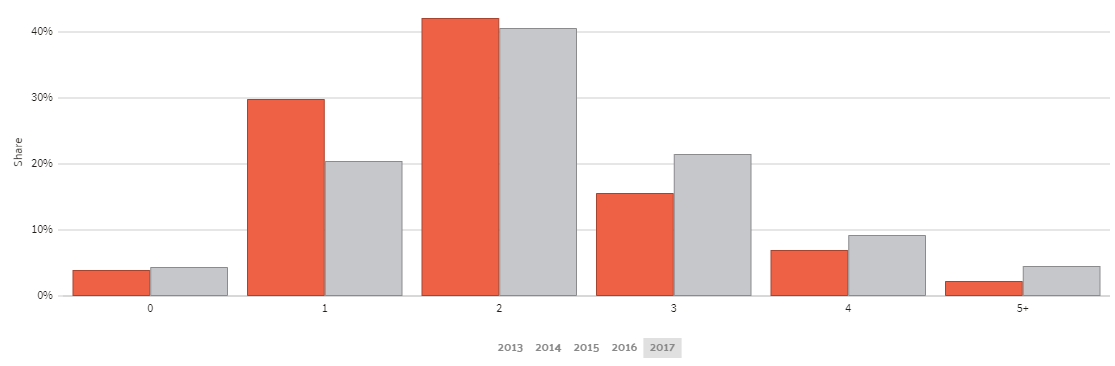
– Households Without Cars
Not everyone is able to have multiple vehicles; however, and in fact, some people are unable to have a vehicle at all.
| 2015 Households without Vehicles | 2016 Households without Vehicles | 2015 Vehicles per Household | 2016 Vehicles per Household |
|---|---|---|---|
| 8.30% | 8.10% | 1.58 | 1.59 |
Having approximately eight percent of the Houston population without vehicles isn’t such a terribly surprising statistic. Why? Well, as Houston is such a large and populated city, it would make sense that a lot of people who live in the city to opt not to have a vehicle and instead chose local transportation.
– Speed-traps in Houston
If you were thinking of trying to speed while in the Houston area, you might want to think again. Speed-traps are areas on the road in which hidden law enforcement officers are located to detect vehicles that are exceeding a speed limit, usually by the use of radar. Just how prevalent are speed traps in Houston, you may ask?
Houston is ranked as the number 1 worst city in all of Texas for speed-traps!
That’s right! There are approximately 45 speed-traps hidden around the city, with an approximate 77 percent acknowledgment rate for these traps.
So if you want to avoid getting any avoidable, and often very costly, speeding tickets make sure you read the surrounding speed limits posted while you are driving.
– Vehicle Theft in Houston
In addition to all the other things normal drivers have to worry about for their vehicles, you have to watch out for vehicle thefts too. Houston citizens, in particular, should keep a close eye on their vehicles. But why would that be?
According to a 2013 crime report by the FBI, Houston had 2,180,606 citizens living in the Houston area, and over 13,595 vehicles stolen!
In addition to this, another crime report states that Houston more recently has a reported total of 11,680 motor vehicle thefts in the area, making that 5.05 vehicle thefts per 1,000. Ouch!
That’s a very large number of vehicles stolen, the most stolen in any city in all of Texas. To help calm your nerves about this, however, we’ve found a list of the safest Houston neighborhoods that can be found below.
The safest Houston neighborhoods:
- Dogwood Acres / Walden Woods
- Westheimer Parkway / S Ferry Road
- Clodine
- Sandtown Circle / Sandtown Lane
- Clodine Reddick Road / Beechnut Boulevard
- Olcott
- Porter Heights
- River Terrance
- Echo Mountain Drive / Mills Branch Drive
- Telge Road / Northwest Freeway
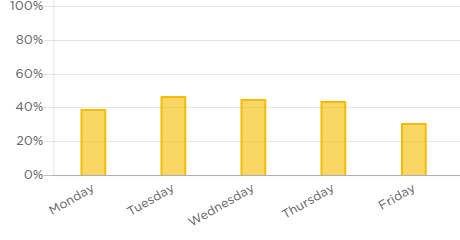
– Traffic
What’s one thing that you can think of that is one of the most annoying parts of your daily commute? That’s right, traffic. It’s an unfortunate reality of living in a big city, and Houston is no exception.
– Traffic Congestion in Texas
Houston has unfortunately made it onto most traffic scorecard sheets due to its densely populated area. As it is one of the largest cities in all of Texas, it would make sense that drivers tend to experience a little more traffic than other cities in the state.
We’ve gone through and collected some traffic congestion data to help you know just how congested the Houston area can be.
Houston is ranked by the TomTom traffic Index as the 117th most congested city in the world, according to their database for 2016. Citizens tend to see approximately 24 percent extra travel time while driving in the Houston area, which is actually a one percent decrease since the previous year.
Typical extra travel time seen by Houston citizens is approximately 32 minutes per day, meaning that drivers spend at least 121 hours per year in traffic in Houston.
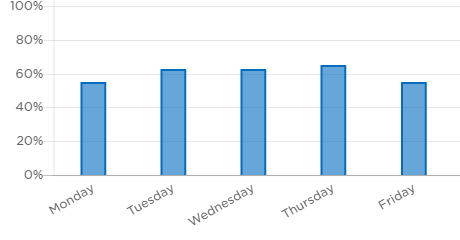
Percent of Congestion:
- Morning Peak: 41 percent
- Evening Peak: 60 percent
- Highways: 21 percent
- Non-highways: 28 percent
Morning Peak (Extra Travel Time):
Evening Peak (Extra Travel Time):
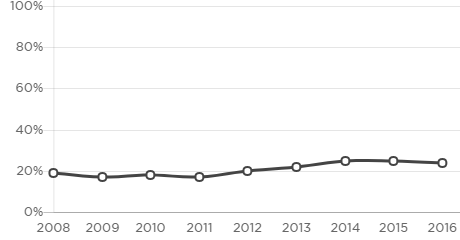
Congestion Level History (Extra Travel Time):
| 2018 Impact Rank (2017) | Hours Lost in Congestion | Year over Year Change | Cost of Congestion (per driver) | Inner City Travel Time (minutes) | Inner City Last Mile Speed (mph) |
|---|---|---|---|---|---|
| 77 (82) | 98 (118) | + 6% | $1,365 | 4 | 15 |
According to Numbeo’s traffic index for 2019, Houston is ranked as the number 6 most congested city in America.
| Traffic Index | Time Index (in minutes) | Time Exp. Index | Inefficiency Index | CO2 Emission Index |
|---|---|---|---|---|
| 208.5 4 | 42.21 | 2329.73 | 242.95 | 10501.04 |
– Transportation
Going off of the previous section, how long can you really expect, on average, to be in traffic while in Houston? Well, on average, the commute time in Houston, Texas is approximately 26.5 minutes. This means that compared to the national average, 25.5 minutes, Houston employees are spending MORE time commuting than the average American citizen.
In addition, approximately 1.96 percent of the workforce in Houston has something known as a “super commute”, which is a commute of over 90 minutes.
Of these drivers out on the road, it’s estimated that 77 percent of drivers are driving alone during their commutes, followed by those who carpool at 10.4 percent.
![]()
– Busiest Highways
We’ve talked briefly about some of the highways located in and around the Houston area, but what is the absolute busiest?
The busiest route in Houston is Route 6, which is a 12-lane highway.
The best advice we can give to you to avoid such a heavily populated highway is to try and find alternative routes instead of Route 6, it might save you some time, patience, and even gas.
– How Safe are Houston’s Streets and Roads?
Houston is a relatively safe place to live, but is it a safe place to drive? We’ve collected the fatality rates in 2017 for all of Harris County, the county Houston is located in, for various fatality types. All of the information listed below comes from Harris County data.
| Type of Fatality (2017) | Number of Fatalities |
|---|---|
| Involving an Alcohol-Impaired Driver | 202 |
| Single Vehicle Crash | 242 |
| Involving a Large Truck | 47 |
| Involving Speeding | 105 |
| Involving a Roadway Departure | 173 |
| Involving an Intersection | 115 |
| Passenger Car Occupant | 149 |
| Light Truck and Van Occupant | 97 |
| Motorcyclist | 76 |
| Pedestrian | 109 |
| Pedal-cyclist | 14 |
| Total Number of Crashes | 456 |
– Allstate America’s Best Drivers Report
In 2018, Allstate created a list of the top cities where drivers are the least likely to have a car accident. The data to support it came from a variety of factors such as the city’s population density, weather conditions, and more.
Houston, Texas was listed as the 164th safest city in the United States to drive in.
| 2018 Best Drivers Report Rank | Average Years Between Claims | Relative Claim Likelihood )Compared to National Average) | 2018 Drivewise® Hard-Braking Events Per 1/1,000 Miles | 2017 Best Drivers Report Ranking | Change in Ranking From 2017 to 2018 | 2018 Ranking After Controlling for Population Density | 2018 Ranking After Controlling for Average Annual Precipitation | Suburban Metro Area | Average Years Between Claims (Suburban Metro Area) |
|---|---|---|---|---|---|---|---|---|---|
| 164 | 6.9 | 44.40% | N/A | 167 | + 3 | 167 | 156 | Houston - The Woodlands - Sugar Land, TX | 8 |
– Ridesharing
Ridesharing has become an extremely popular form of transportation over the past couple of years. You know the ones, like Uber or Lyft that you can order with the press of a button on your smartphone. Especially in such a big city, the popularity of such services absolutely skyrockets in demand.
Want to know the most common ridesharing services available in Houston? Check out the list below:
Ride-sharing is taking over a lot of major cities, watch the video below to see why!
https://youtu.be/RK4cQh1FQnk
– EStar Repair Shops
Let’s say that you’re driving down the road in Houston and your vehicle breaks down, where can you go? We’ve taken a look at the top E-Star Repair shops in the area to help you know where to go.
What are E-Star Shops? They are repair facilities that have been labeled as top-quality for repairs as well as customer service. Check out the list below if you’re ever in a pinch.
For the data below we used the zip code 77002, for downtown Houston.
| Name of E-Star Repair Facility | Address | Contact Information | Distance (from 77002 zip code) |
|---|---|---|---|
| RUSSELL & SMITH FORD HONDA | 1109 SOUTH LOOP W HOUSTON TX 77054 | email: [email protected] P: (713) 663-4216 F: (713) 663-4110 | 5 miles |
| MILLER AUTO & BODY REPAIR | 4816 N SHEPHERD HOUSTON TX 77018 | email: [email protected] P: (713) 864-7820 F: (713) 864-6280 | 6 miles |
| SERVICE KING GALLERIA | 5919 WESTHEIMER ROAD HOUSTON TX 77057 | email: [email protected] P: (713) 243-1400 F: (713) 266-4316 | 7 miles |
| CARSTAR PREMIER | 9520 RICHMOND AVE HOUSTON TX 77063 | email: [email protected] P: (713) 952-3777 | 10 miles |
| SERVICE KING SOUTHWEST FREEWAY | 10475 SOUTHWEST FREEWAY HOUSTON TX 77074 | email: [email protected] P: (713) 773-5000 F: (713) 772-1746 | 12 miles |
| SERVICE KING PEARLAND | 2330 SMITH RANCH ROAD PEARLAND TX 77584 | email: [email protected] P: (713) 795-3100 F: (800) 214-2373 | 13 miles |
| SUNRISE PAINT & BODY INC. | 4211 COOK RD HOUSTON TX 77072 | email: [email protected] P: (281) 933-7473 F: (281) 933-9426 | 14 miles |
| CHARLTON'S BODY REPAIR CF | 1131 STAFFORDSHIRE RD STAFFORD TX 77477 | email: [email protected] P: (281) 499-1126 F: (281) 499-1694 | 15 miles |
| SERVICE KING HUMBLE | 450 E FM 1960 HUMBLE TX 77338 | email: [email protected] P: (281) 446-6660 F: (800) 214-2373 | 18 miles |
| GREENFIELD COLLISION CENTER | 15920 KUYKENDAHL HOUSTON TX 77068 | email: [email protected] P: (281) 580-1994 F: (281) 580-3205 | 19 miles |
– Weather
One factor a lot of people don’t take into consideration while driving is the weather. Sure, if you’ve been living in one particular area for a long time, it makes sense that certain factors wouldn’t worry you.
If you were living down in the south of Texas, for example, it’s not exactly a hot spot for snow. So it would make sense that snow isn’t a major concern.
It’s important though, that each driver takes into account what weather they are driving in. You never know what lies in waiting out there on a hot summer day, or a cold wintery night.
We’ve collected some of the average weather conditions in Houston to get the bigger picture.
| Houston Weather Averages | Details |
|---|---|
| Annual High Temperature | 78.3°F |
| Annual low temperature | 59.8°F |
| Average temperature | 69.05°F |
| Average annual precipitation - rainfall | 45.28 inch |
| Days per year with precipitation - rainfall | 106 days |
| Annual hours of sunshine | 2633 hours |
| Av. annual snowfall | N/A |
Got some nice weather there Houston! The biggest weather factor Houston citizens have to worry about is the high temperatures during the summertime, as snowfall is pretty rare for the area.
While the weather seems to be sunshine and smiles in Houston, there is a fair share of natural disasters that have swept through the area. In fact, Harris County (where Houston is located) has a greater number of natural disasters in the area than the average United States city.
There have been 22 major disasters, and of those, six were declared as emergencies. What makes up these 22 natural disasters in the area (keep in mind though that some incidents may be assigned to more than one category)?
- 6 – Storms
- 15 – Floods
- 15 – Hurricanes
- 7 – Tornadoes
- 3 – Tropical Storms
- 2 – Fires
- 2 – Winds
Remember, Houston is pretty close to the coast, so it is prone to being side-swiped by hurricanes and tropical storms, such as Hurricane Harvey in 2017. In addition to that, most of Texas is in what is called ‘Tornado Alley’, where tornadoes are most likely to spawn.
So while the average weather is usually pretty idealistic, natural disasters still plague the area, as any area of the United States is. If you are to hear of any odd or dangerous weather in the Houston area, make sure you take extra precautions to keep yourself safe. Especially if you are on the road.
– Public Transit
If you don’t own your own vehicle, what are some of the other transportation options you have available to you in Houston? Well luckily for Houston citizens, or even tourists wanting to visit the city, there are a good number of transportation options that are available to you.
Here are just a couple of the most common transportation options in Houston:
| Transportation Option | Cost | Routes / Details (if listed) |
|---|---|---|
| METRORail | $1.25 | -Red Line : (25 Stations) Northline Transit Center to Fannin South -Green Line: (9 Stations) Downtown to Magnolia Park Transit Center -Purple Line: (10 Stations) Downtown to Palm Center Transit Center |
| METRO Bus System | Local Service Fare: $1.25 One-Way Fare: ranges from $2-4.50 depending on distance | - Local services runs mostly on city streets - Park & Ride Service is for long-distance commuting - METRO's 28 Park & Ride lots provide bus service to key destinations |
| Taxi | $6 | flat taxi fare for all trips in the downtown area |
| Ridesharing Services | depends upon service | depends upon service |
| SuperShuttle | ranges from $23- 200 depending on destination | -Shared Ride -Non-Stop Ride -Black Car |
– Parking in Metro Areas
Parking in downtown Houston can be a challenge, as with any major city in the nation.
There are numerous parking garages located throughout the city and have approximately 100,000 parking spaces in the downtown area. Of those parking spaces, 2,200 are on-street, 24,000 are surface parking lot spaces, and 75,000 are garage spaces.
On-Street Parking facts you should know:
- On-street metered parking is available during the day and on most downtown streets
- You can park up to three hours, and after that, you will have to move your vehicle
- Meters are FREE after 6 p.m. Monday through Saturday and is free all day Sunday
In addition, there are many parking tips given by the city of Houston, and they are as follows:
- Pay close attention to street signs – as some metered areas turn into tow-away zones during certain times of the day
- Avoid spots with red markings – if a curb is painted red/there are red stripes on the street, that means the designated spot is off limits at all times
- Be careful of time limits – most meters downtown have a 3-hour time limit, and after that, you will need to move your vehicle
- Avoid commercial meters – these meters (usually painted in red) designate parking spots for commercial vehicles only
- Utilize hi-tech parking meters – most of the downtown area have smart meters that are easy to use
- Purchase a Downtown Hopper pass – you pay a one-time daily fee which allows you to move from block to block or meter to meter throughout the downtown area without having to pay the meter each time
– Air Quality in Houston
Have you ever noticed that thick layer of smog seen in most images of the Los Angeles area? It has to do with something known as the air quality, with larger cities tending to have poorer air quality than more rural areas.
According to the EPA, the Houston area has the following air quality:
| Year | Number of Days with AQI | Number of "Good" Days | Number of "Moderate" Days | Number of "Unhealthy for Sensitive Groups" Days | Number of "Unhealthy" Days | Number of "Very Unhealthy" Days |
|---|---|---|---|---|---|---|
| 2018 | 365 | 166 | 164 | 26 | 7 | 2 |
| 2017 | 365 | 184 | 156 | 22 | 3 | 0 |
| 2016 | 366 | 164 | 179 | 22 | 1 | 0 |
| 2015 | 365 | 144 | 176 | 30 | 14 | 1 |
Vehicle emissions are one of the leading causes of poor air quality across the nation. Vehicles can emit a large amount of air pollution into the air.
A lot of cities across the world have been dealing with this issue for many years, some of which are starting to crack down on reducing the number of cars and vehicles on city roads in order to try and improve air quality.
Don’t believe us? Check out this video about Delhi, India, which has been labeled as having the most air pollution in the world.
https://youtu.be/rEbNsn91XV0
Military/Veterans in Houston
In this section, we’ll talk about the military and veteran population in the Houston area.
The three most common service periods for veterans in the Houston area are:
- Vietnam: 20,569 veterans
- Gulf War (2000s): 17,611 veterans
- Gulf War (1990s): 10,103 veterans
Houston, Texas has the largest population of military personnel who served in Vietnam, which is over 117 times greater than any other conflict in history.
Why would there be so many veterans in Houston? Simple. Texas, in general, has a pretty decent number of military bases located across the state.
Most of these are located in the San Antonio area, but bases such as the Ellington Field Joint Reserve Base, Houston MEPS, and the National Guard are located more closely to the Houston area.
Want to see all of the military bases located in Texas?
- Camp Bullish
- Dyess Air Force Base
- Fort Bliss
- Fort Hood
- Fort Sam Houston
- Goodfellow Air Force Base
- Joint Base San Antonio
- Lackland Air Force Base
- Laughlin Air for Base
- Naval Air Station Corpus Christi
- Naval Air Station Joint Reserve Base Fort Worth
- Randolph Air Force Base
- Red River Army Depot
- Sheppard Air Force Base
If you are military personnel in the Houston area, we have good news for you. There are several insurance providers who have military discounts available.
The following insurance providers offer military discounts to drivers:
- Allstate
- Farmers
- Geico
- Liberty Mutual (must be active duty)
- MetLife
- Safeco (both active and retired)
- USAA (you, your spouse or your parents must be active or retired military to get USAA auto insurance)
If you’re a veteran or in the military, Houston has a lot of good options for you, including some nice discounts for you. We also would like to thank you for your service!
Unique City Laws
In Houston, there have been a few new driving laws that have come out over the past few years. We’ve put together some information for these laws in Houston that drivers will want to know.
– Texting While Driving:
In September of 2017, a law went into effect that prohibits texting while driving. There are a few exemptions for this law, which include using a navigation device or stereo controls. A first-time offender can receive a fine of $25 to $99 while a repeat offender can expect fines of about $100 to $200.
If texting were to be found to be the cause of an accident that resulted in serious injury or death, the driver can be charged with a Class A misdemeanor. Why is that so serious? A Class A misdemeanor comes with a fine of up to $4,000 as well as a jail term of up to one year.
Make sure you put your phones on silent and answer that text after you’re not driving while in Houston.
– Good Samaritans and Civil Liability:
This law was put into effect so that a person, such as a child or a disabled person, can not be forgotten in a hot car. It was shown that from 1998 to 2018, more than 114 people had died after being left in a hot vehicle from heat stroke.
This new law states that anyone who witnesses a person in distress inside a vehicle is allowed to break into that vehicle to provide assistance and that this person will not be held liable for any damages.
– Verification of Driving Without Car Insurance:
This law requires law enforcement officers to make a valid attempt at verification of an existing insurance policy before they can issue you a ticket for driving without the required insurance.
What exactly does this mean? Well, let’s say you’re driving around in Houston and you get pulled over for something by law enforcement.
You have your insurance with you, it’s just hidden beneath some papers in your dashboard. So with this new law, it helps to protect you if you don’t immediately produce your insurance to law enforcement.
Houston Car Insurance FAQ’s
Down to the last section of this guide! Here, we’ll go over some of the most common car insurance questions that Houston drivers may have.
– If I’m moving to Houston, can I keep my current driver’s license?
If you’re moving to the Houston area from another city in Texas, you’ll need to simply update your license to your new living address.
If you’re moving to the Houston area from another state, you’ll need to visit your local DMV office to transfer your license. Requirements vary from state to state, but in more cases, some of the following requirements will apply:
- Your current driver’s license (the out-of-state one)
- Proper identification (birth certificate for example)
- Social Security Number
- Proof of residency in Houston (such as a lease agreement for an apartment, or paperwork for a house payment)
- Pass a vision test
- Have payment for the new license
If you need any help trying to get a new license to transfer out of state, make sure to check the DMV for any assistance.
– Should I even own a vehicle in Houston?
Houston is such a large and expansive city that most Houston citizens recommend having some sort of vehicle available to transport yourself around.
While the city does offer a large variety of alternative transportation such as city buses, trollies, and shuttles, according to most residents they aren’t the most reliable systems. Fortunately for residents of Houston, there are talks that the METRO system will be expanding in the future.
Plus, summers can be pretty brutal in the Houston area, and having to walk to all of your locations probably isn’t the best idea.
– Can the higher temperatures in Houston affect my car?
Yes, they can. Houston is known for having higher temperatures during the summertime, in the excess of 90 degrees Fahrenheit and above. In addition to the high temperatures, Houston is known for getting extremely humid due to its close location to the coast.
So how exactly does this affect your vehicle then? Well, with higher temperatures and more humidity, it’ll force your vehicle to work harder in order to produce power. Therefore it can increase the chance that your parts will wear out more quickly than if you were in a cooler climate.
It is definitely something to keep in mind during the summertime!
– Should I take commute into consideration when I chose where to live?
Absolutely. Houston isn’t the most walkable city, as it is very large and spread out. In addition to that, it’s one of the biggest and most populated places in the country, therefore making traffic a pain. Traffic congestion, which we talked about in a previous section, can be pretty hectic in the city.
So if you don’t want to have to sit in traffic for hours on end, it is definitely wise to see if you can find a place to live a little closer to where you’re going to work. Your road rage will thank you later for it!
– Is it worth it to get an EZ tag?
It definitely can be if you are going to become a frequent flyer on the toll roads in the area! You pay 30 dollars in advance to get an electronic tag on your windshield, and this allows you to drive straight through the toll without having to stop.
It saves you 25 cents on the $1 toll. The EZ tag office will also notify you when your $30 is about to expire.
In conclusion, yeah it’s definitely worth it to get an EZ tag. Plus, think of all of the traffic you can avoid by taking the toll roads, which tend to be less crowded than the regular highways.
We hope that this comprehensive guide for Houston, Texas drivers will help make your life a little easier! Safe driving out there in the Lone Star State.
Do you want to start comparing car insurance rates today? Use our FREE online tool now, all you need is your zip code to get started.